Fig 2.
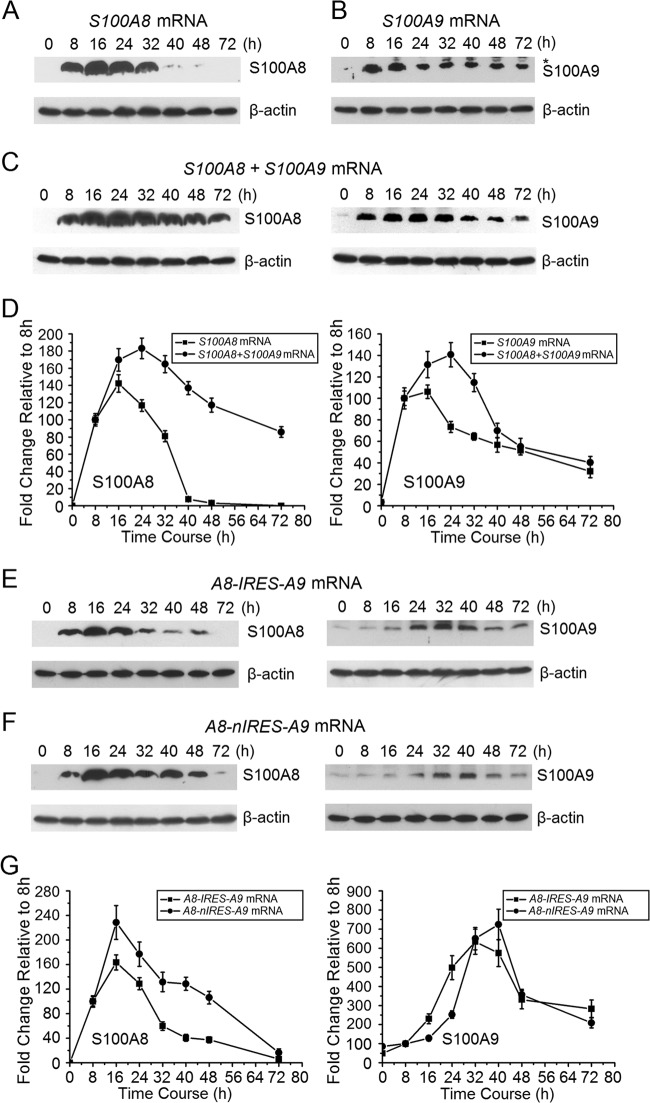
S100A8 and S100A9 protein expression by KB cells after transfection with ARCA-capped S100A8, S100A9, A8-IRES-A9, or A8-nIRES-A9 mRNA. (A) S100A8 protein expression after KB cells were transfected with S100A8 mRNA, as detected using Western blot analysis. Identical experiments were performed to determine the time course of expression of S100A9 protein (B); S100A8 and S100A9 protein levels after KB cells were cotransfected with S100A8 and S100A9 mRNAs (C); S100A8 and S100A9 protein levels after cells were transfected with S100A8, S100A9, or S100A8/S100A9 mRNA (D); S100A8 and S100A9 protein levels after KB cells were transfected with A8-IRES-A9 mRNA (E); and S100A8 and S100A9 protein levels after KB cells were transfected with A8-nIRES-A9 mRNA (F). (G) S100A8 and S100A9 proteins were quantitated after cells were transfected with A8-IRES-A9 and A8-nIRES-A9 mRNAs, respectively. Intensity levels of each band are normalized to that of β-actin. Protein expression 8 h after mRNA transfection was set to 100. Representative images are shown. Error bars show the means ± SD for three to six independent experiments.

