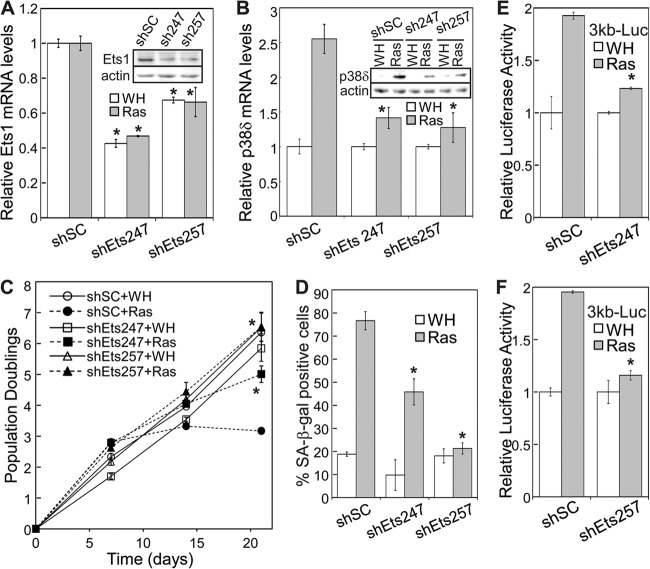
Fig 10.
Ets1 is essential for oncogenic ras-induced p38δ expression and senescence. (A) Relative levels of Ets1 mRNA in BJ cells transduced with a scrambled shRNA (shSC) or Ets1 shRNA (shEts247 and shEts257) and Ha-rasV12 (Ras) or vector (WH), as detected by quantitative real-time RT-PCR on day 8 after ras transduction. Signals were normalized first to that of PBGD and then to that from cells transduced with scrambled shRNA control (shSC). Values are means ± SDs for triplicates. *, P < 0.05 versus shSC by Student's t test. (Inset) Western blot analysis of BJ cells transduced with a scrambled shRNA (shSC) or Ets1 shRNA (shEts247 and shEts257). (B) Relative levels of p38δ mRNA in BJ cells transduced with a scrambled shRNA (shSC) or Ets1 shRNA (shEts247 and shEts257) and Ha-rasV12 (Ras) or vector (WH), as detected by quantitative real-time RT-PCR on day 8 after ras transduction. Signals were normalized first to that of PBGD and then to that from cells transduced with vector control (WH). Values are means ± SDs for triplicates. *, P < 0.05 versus shSC by Student's t test. (Inset) Western blot analysis of the same cell lines. (C) Growth curve of BJ cells transduced with a scrambled shRNA (shSC) or Ets1 shRNA (shEts247 and shEts257) and Ha-rasV12 (Ras) or vector (WH) over 21 days starting on day 5 after ras transduction at PD 29. Values are means ± SDs for duplicates. *, P < 0.05 versus shSC by Student's t test. (D) Percentage of SA-β-Gal-positive cells in BJ populations transduced with a scrambled shRNA (shSC) or Ets1 shRNA (shEts247 and shEts257) and Ha-rasV12 (Ras) or vector (WH) on day 12 after ras transduction. Values are means ± SDs for duplicates. *, P < 0.01 versus shSC by Student's t test. (E and F) BJ cells stably transduced with the 3-kb p38δ promoter luciferase reporter were transduced first with a scrambled shRNA (shSC) or Ets1 shRNA (shEts247 in panel E and shEts257 in panel F) and then with Ha-rasV12 (Ras) or vector (WH). Cells were lysed on day 8 after Ras transduction. Luciferase activity was measured and normalized to protein concentration. Fold induction by ras was calculated by dividing the luciferase activity in ras-expressing cells by that in control cells. Values are means ± SDs for triplicates. *, P < 0.005 versus shSC by Student's t test.

