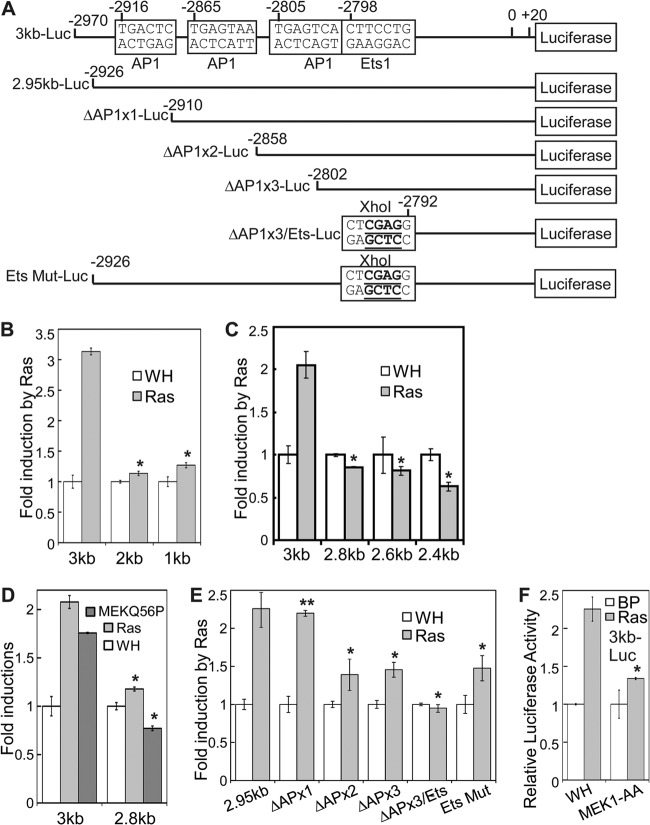
Fig 6.
Induction of p38δ transcription by oncogenic ras requires the AP-1 and Ets transcription factor binding sites on the p38δ promoter. (A) Schematic diagram of the p38δ promoter reporter constructs carrying deletion or mutation of the AP-1 and Ets transcription factor binding sites within the upstream region from kb −3 to −2.8 of the transcription start site. (B) BJ cells stably transduced with a retroviral luciferase reporter containing a 3-kb, 2-kb, or 1-kb p38δ promoter sequence (3kb, 2kb, or 1kb, respectively) upstream of the transcription start site was transduced with Ha-rasV12 (Ras) or vector (WH). *, P < 0.001 versus 3kb by Student's t test. (C) BJ cells stably transduced with a retroviral luciferase reporter containing a 3-kb, 2.8-kb, 2.6-kb, or 2.4-kb p38δ promoter sequence upstream of the transcription start site was transduced with Ha-rasV12 (Ras) or vector (WH). *, P < 0.01 versus 3kb by Student's t test. (D) BJ cells stably transduced with a retroviral luciferase reporter containing a 3-kb or 2.8-kb p38δ promoter sequence upstream of the transcription start site was transduced with Ha-rasV12 (Ras), MEK1Q56P, or vector (WH). *, P < 0.005 versus 3kb by Student's t test. (E) BJ cells stably transduced with a retroviral luciferase reporter containing a 2.95-kb wild-type p38δ promoter sequence upstream of the transcription start site (2.95kb) or that harboring deletion of one (ΔAPx1), two (ΔAPx2), or all three (ΔAPx3) AP-1 binding sites and/or mutation of the Ets binding site within the region from kb −3 to −2.8 (Ets Mut) was transduced with Ha-rasV12 (Ras) or vector (WH). *, P < 0.05; **, P > 0.5 (versus 2.95kb; by Student's t test). (F) BJ cells stably transduced with a retroviral luciferase reporter containing a 3-kb p38δ promoter sequence upstream of the transcription start site was transduced first with a dominant negative mutant of MEK1 (MEK1-AA) or vector (WH) and then with Ha-rasV12 (Ras) or vector (BP). *, P < 0.005 versus WH by Student's t test. For panels B to F, cells were lysed on day 6 to 8 after Ras transduction. Luciferase activity was measured and normalized to protein concentration. Fold induction by ras/MEK1Q56P was calculated by dividing the luciferase activity in ras/MEK1Q56P-expressing cells by that in control cells. Values are means ± SDs for triplicates.

