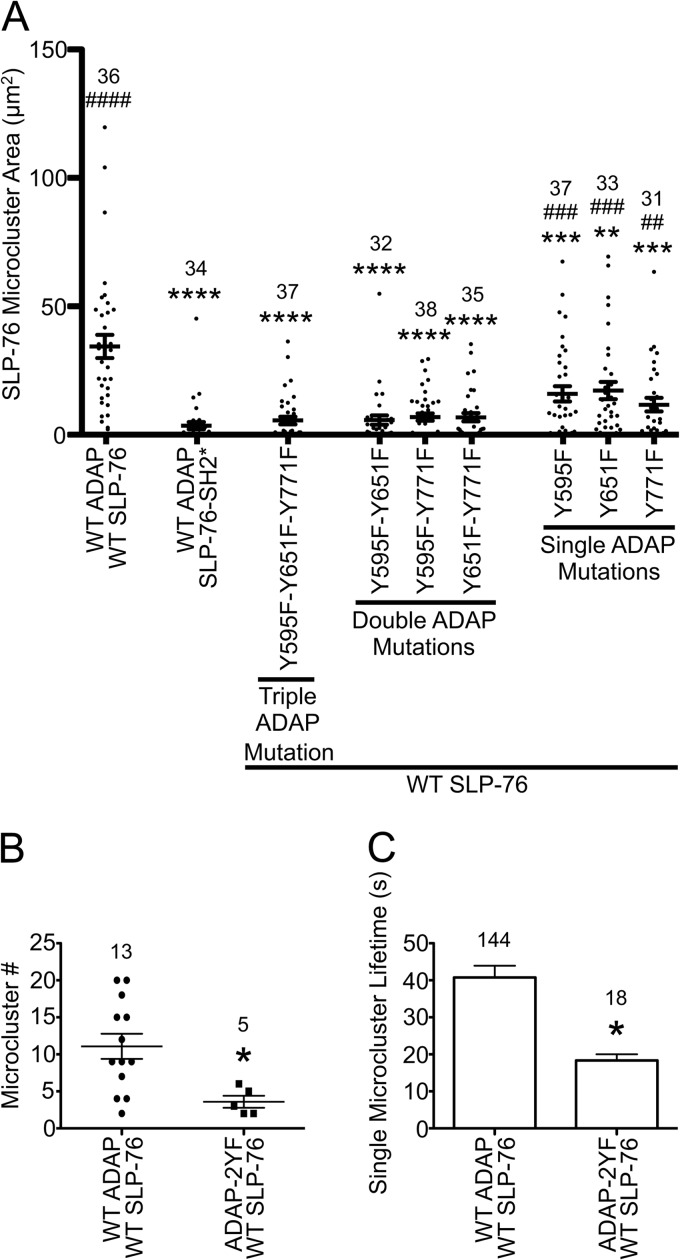
Fig 4.
Assembly and persistence of SLP-76 microclusters requires multiple ADAP binding sites. (A) Area of TCR-induced SLP-76 microclusters in stable cell lines. The indicated cell lines were plated on stimulatory coverslips, fixed after incubation at 37°C for 3 min, and imaged with a spinning-disk confocal system. Single z-slices with the highest intensity punctae at the cell surface were chosen, and the total area of SLP-76 microclusters in each cell was calculated using Imaris software and plotted. Means are presented along with error bars representing ±SEM. Significant deviations from the values of cells expressing wild-type proteins or SLP-76-SH2* are indicated, respectively, as follows: * or #, P = 0.01 to 0.05; ** or ##, P = 0.001 to 0.01; *** or ###, P = 0.0001 to 0.001; **** or ####, P < 0.0001. The number of cells analyzed for each sample is shown above the symbols. (B and C) Analysis of SLP-76 microclusters from live-cell imaging. SLP-76-deficient Jurkat T cells (J14) expressing wild-type SLP-76-mYFP and either wild-type ADAP-mCerulean or ADAP-Y595F-Y651F-mCerulean proteins were imaged with a spinning-disk confocal system. Live-cell imaging began shortly after the cell contacted the coverslip. Movies were prepared with Slidebook software from z-stacks by making a maximum-intensity projection of each time point and assembling a sequence of all projections. Microcluster lifetimes were determined using particle tracking from Slidebook software. Mutations to Y595 and Y651 reduce the number (B) and lifetime (C) of SLP-76 microclusters in live cells.

