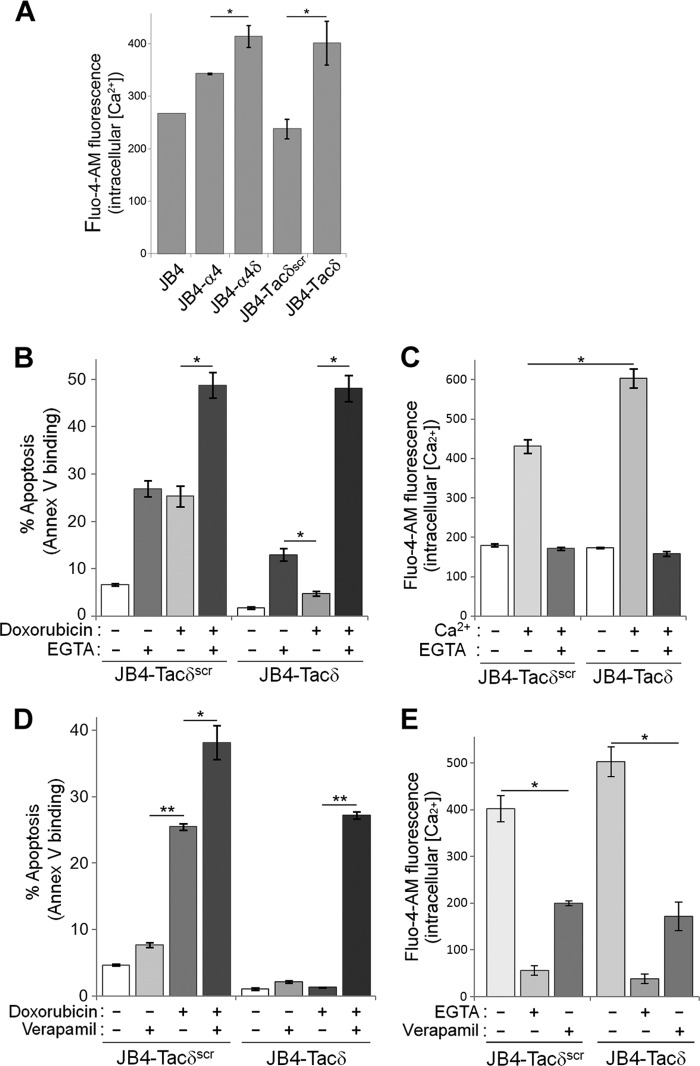
Fig 5.
Blockade of L-type calcium channels attenuates chemoresistance to doxorubicin. (A) Intracellular Ca2+ measurements of JB4-derived cell lines via flow cytometry. The indicated cells were labeled with Fluo-4-AM as described in Materials and Methods, washed free of the dye, and resuspended in PBS with or without 1 mM CaCl2 at 22°C for 10 min prior to measurements. Data plotted are the intracellular calcium measurements obtained from 1 mM CaCl2–PBS subtracted from fluorescence with PBS alone (means ± standard deviations; n = 4). *, P < 0.01. (B) JB4-Tacδ and JB4-Tacδscr cells were treated with combinations of 0.04 μg/ml doxorubicin and/or 0.6 mM EGTA for 48 h. Data plotted are the percentage of apoptotic cells, based on flow cytometry determination of Cy5-annexin V binding (means ± standard deviations; n = 4). *, P < 0.001. (C) Fluo-4-AM fluorescence measurements of intracellular Ca2+ in JB4-Tacδ and JB4-Tacδscr cells incubated with combinations of extracellular 1 mM Ca2+ and/or 0.6 mM EGTA (means ± standard deviations; n = 3). *, P < 0.03. (D) JB4-Tacδ and JB4-Tacδscr cells were treated with combinations of 0.03 μg/ml doxorubicin and/or 60 μM verapamil for 48 h. Data plotted are the percentage of apoptotic cells, based on flow cytometry determination of Cy5-annexin V binding (means ± standard deviations; n = 3). *, P < 0.002; **, P < 0.0001. (E) Fluo-4-AM fluorescence measurements of intracellular Ca2+ in JB4-Tacδ and JB4-Tacδscr cells incubated with 1 mM Ca2+ and 0.6 mM EGTA or 60 μM verapamil (means ± standard deviations; n = 3). *, P < 0.001.

