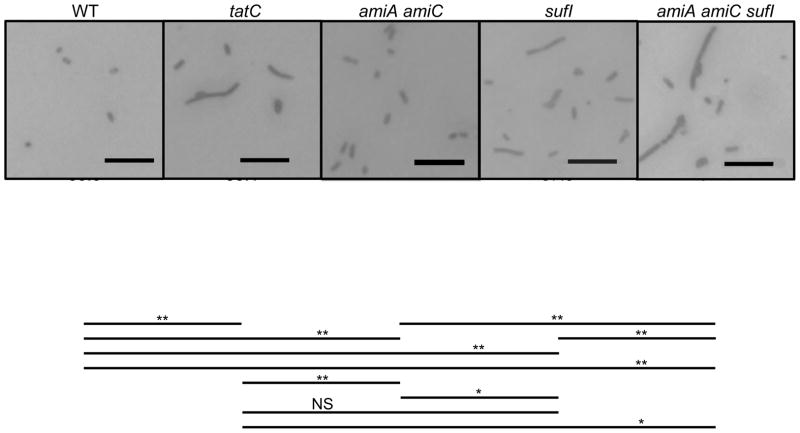
Figure 1.
Microscopic analysis of strains following growth in no salt LB. Strains were grown for 6 h. Cells were washed before fixation and Gram staining and observation by light microscopy at a magnification of ×600. Scale bar=10 μm. At least 250 cells in at least 5 random non-overlapping microscopic fields were counted for calculation of an average number of bacilli in a chain and % single cells. Lines designate statistical comparisons of Avg cells/chain using a Student’s T test. *, p<0.05; **, p<0.005; NS, Not significant. Strains used were 14028, JS1194, JS2002, JS1198, and JS2019.

