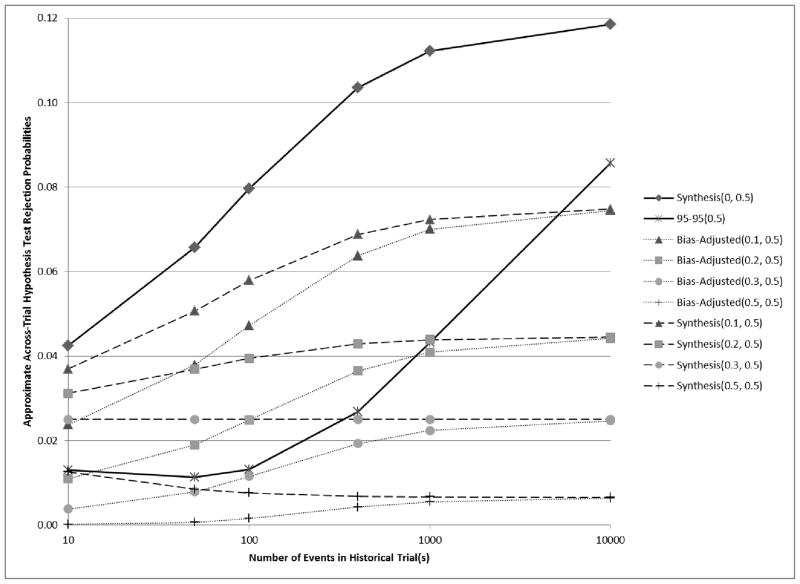
Figure 4.
Curves showing the relationship between the number of events in historical trial(s) and analytical estimates of across-trial rejection probabilities when E[β̂PS,H] = ln(1.68) = 0.52, β̂ES = ln(1.2) = 0.18, and v̂ar(β̂ES) = 4/400 = 0.01. If βPS = (1 − 0.3)E[β̂PS,H] , then βES = 0.5βPS, and under the preservation of effect hypothesis with p = 0.5, we wish to control the non-inferiority test rejection probability below 0.025. Synthesis(λ, p) and Bias-adjusted(λ, p) were evaluated for a range of λ and a fixed p = 0.5.

