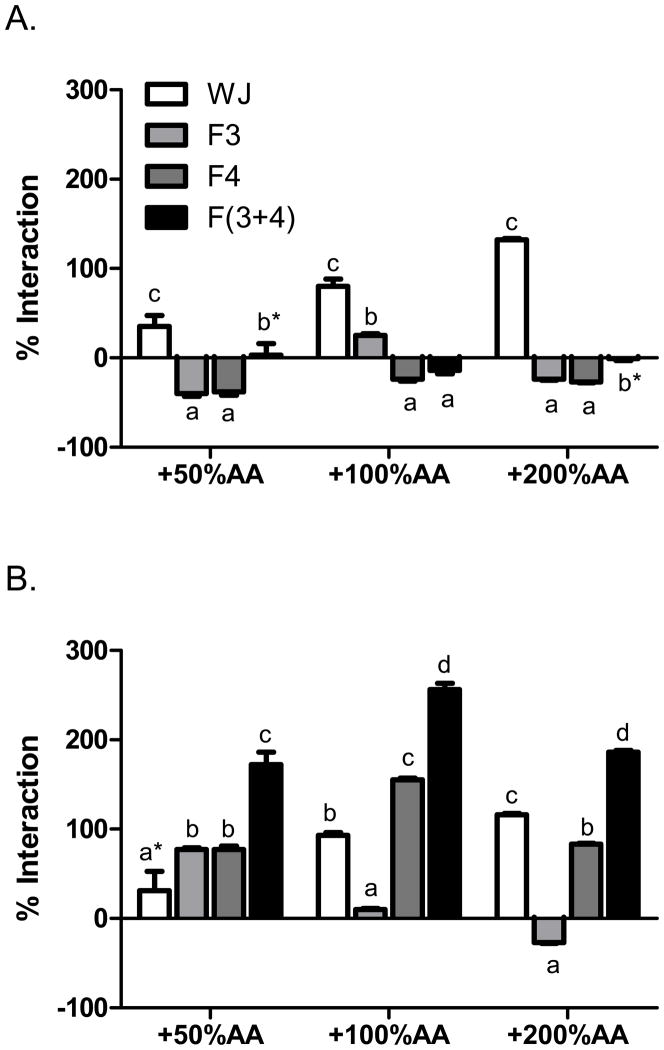
Figure 3.
Interactions between ascorbic acid (AA) and whole juice, neutral phenols (F3), anthocyanins (F4), and recombined neutral phenols and anthocyanins F(3+4) from A. pomegranate nectarine juice and B. grape juice in the FRAP assay. Data are % interaction = 100*(activityactual − activityexpected)/activityexpected, with positive values as synergy and negative values as antagonism. The changes in expected values were 0.91, 1.9, and 3.7 mM Trolox equivalents for 50, 100, and 200 % daily values of added AA respectively. By 2-way ANOVA, both pomegranate and grape juice data were P <0.0001 for juice and fractions, P <0.0001 for AA concentrations, and P <0.0001 for their interaction. Within groups, bars marked with different letters are significantly different by 1-way ANOVA and Tukey’s HSD multiple comparison test, P < 0.05. Bars marked with asterisk (*) AA were not significantly different from expected values by a one sample, two-tailed t-test (P >0.05).

