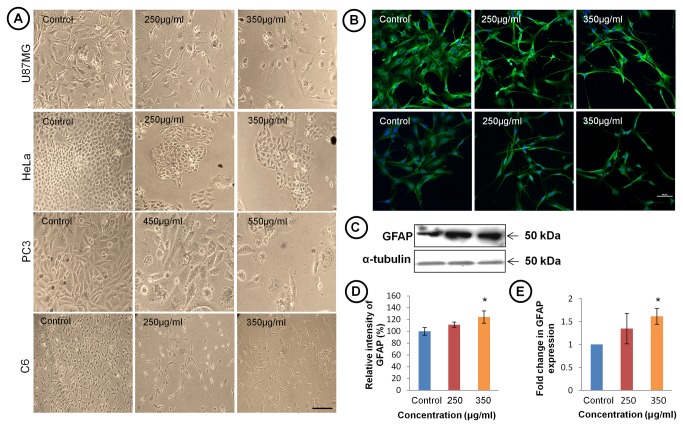
Figure 1. TCE Induces differentiation in U87MG, HeLa, PC3 and C6 cells.
(A) Phase contrast photomicrographs of U87MG, HeLa, PC3 and C6 cell lines treated with TCE showing gradual changes from undifferentiated to highly differentiated morphology. Scale bar- 200 μm. (B) Confocal images of C6 glioma cells showing α-tubulin (upper panel) and GFAP (lower panel) expression. Scale bar- 50 μm. (C) Representative western blot hybridization signals of GFAP expression. (D) Histogram showing densitometric analysis of GFAP protein bands in western blotting in TCE treated and control groups. (E) Histograms representing mRNA expression of GFAP in control and treated groups. Gene expression is represented by ΔΔCt value of GFAP after normalising with 18S RNA as endogenous control. Values are presented as mean ± SEM of at least three independent experiments. ‘*’ (P<0.05) and ‘**’ (p< 0.01) represent statistical significant difference between control and TCE treated groups.

