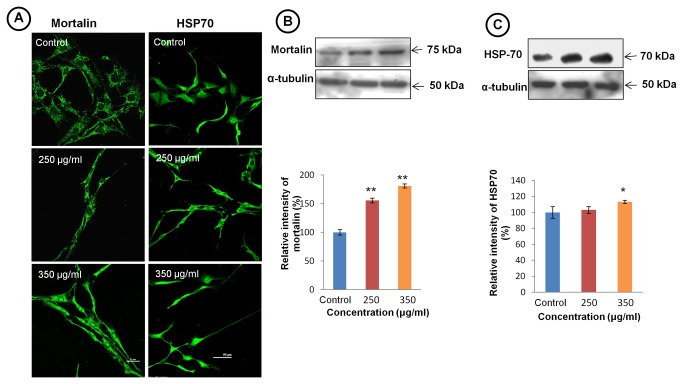
Figure 3. TCE treatment induces senescence in C6 glioma cells.
(A) Representative confocal images of C6 glioma cells immunostained for mortalin (left panel) showing shift of immunostaining from perinuclear to pancytoplasmic and then to nucleus at higher dose (Scale bar- 25 μm). Immunostaining of C6 cells for HSP 70 (right panel) shows differential expression of HSP70 in TCE treated cells (Scale bar- 50 μm). (B) Representative western blot hybridization signals of mortalin. Histogram representing percentage change in mortalin expression in TCE treated and control group. (C) Representative western blot hybridization signals of HSP 70 expression. Histogram representing percentage change in expression of HSP 70 in TCE treated and control group. Values are presented as mean ± SEM. ‘*’ (P<0.05) and ‘**’ (p< 0.01) represent statistical significant difference between control and TCE treated groups.

