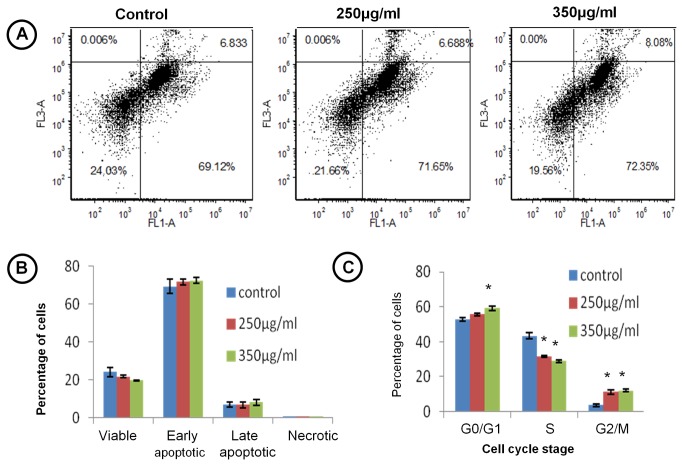
Figure 5. TCE induces apoptosis and cell cycle arrest.
(A) Distribution of viable, early apoptotic, late apoptotic and necrotic cells analysed by extent of expression of annexin V on the surface of cells and total PI uptake by flow cytometer. (B) Histogram showing percentage of cells in viable, early apoptotic, late apoptotic and necrotic stages. (C) Histogram representing distribution of cells in G0/G1, S and G2/M phase of cell cycle analysed by PI stain using flow cytometer. ‘*’ represents statistical significant difference (p<0.05) between control and TCE treated group.

