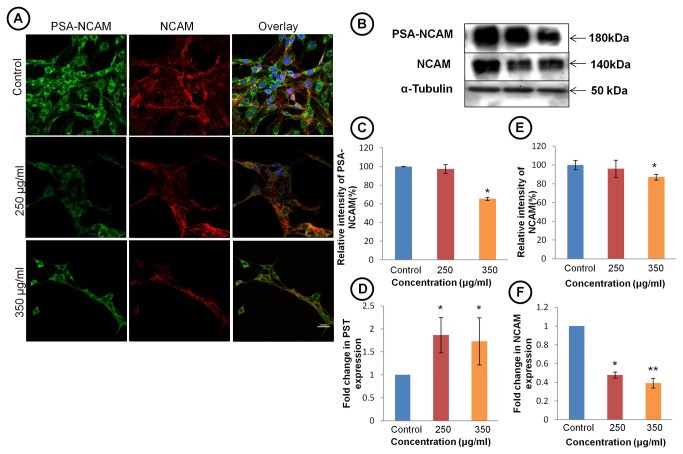
Figure 6. TCE reduces expression of NCAM and PSA-NCAM.
(A) Immunostaining for PSA-NCAM and NCAM in TCE treated and untreated C6 cells (Scale bar- 25 μm). (B) Extent of glycosylation of NCAM estimation by western blot analysis using anti-PSA-NCAM antibody (upper panel). Middle panel represents total NCAM expression. (C) Histogram representing percentage change in expression of PSA-NCAM in TCE treated and control cells. (D) Histograms representing expression of mRNA of PST (enzyme responsible for polysialylation of NCAM moiety) in control and treated cells. Gene expression is represented by ΔΔCt value of PST after normalising with 18S RNA as endogenous control. (E) Histogram presenting densitometric analysis of western blot of NCAM showing decrease in expression of NCAM in dose dependent manner in C6 glioma cells. (F) Histograms representing expression of mRNA of NCAM in control and treated cells. Gene expression is represented by ΔΔCt value of NCAM after normalising with 18S RNA as endogenous control. Values are presented as mean ± SEM. ‘*’ (P<0.05) and ‘**’ (p< 0.01) represent statistical significant difference between control and TCE treated groups.

