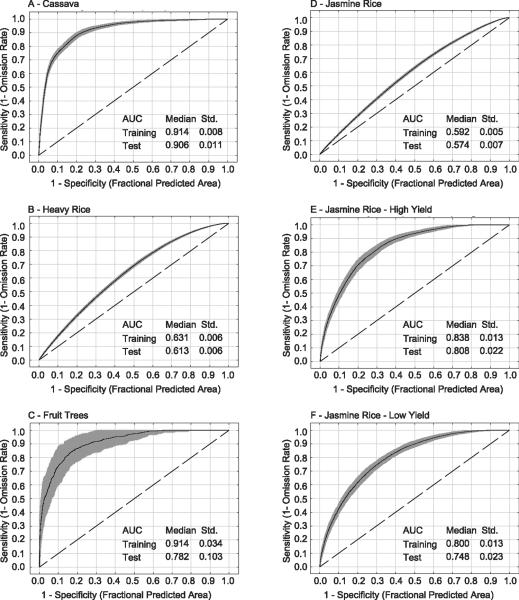
Figure 2.
Receiver operating characteristic (ROC) curves for cassava (A), heavy rice (B), fruit trees (C), jasmine rice (D), jasmine rice – high yield (E), and jasmine rice – low yield (F). The median and standard deviation (std) of the area under the curve (AUC) for the training and testing data are shown in each subplot.

