
Figure 2. Bumblebees running through Manzate-permeated mazes showed decreases in measured performance metrics.
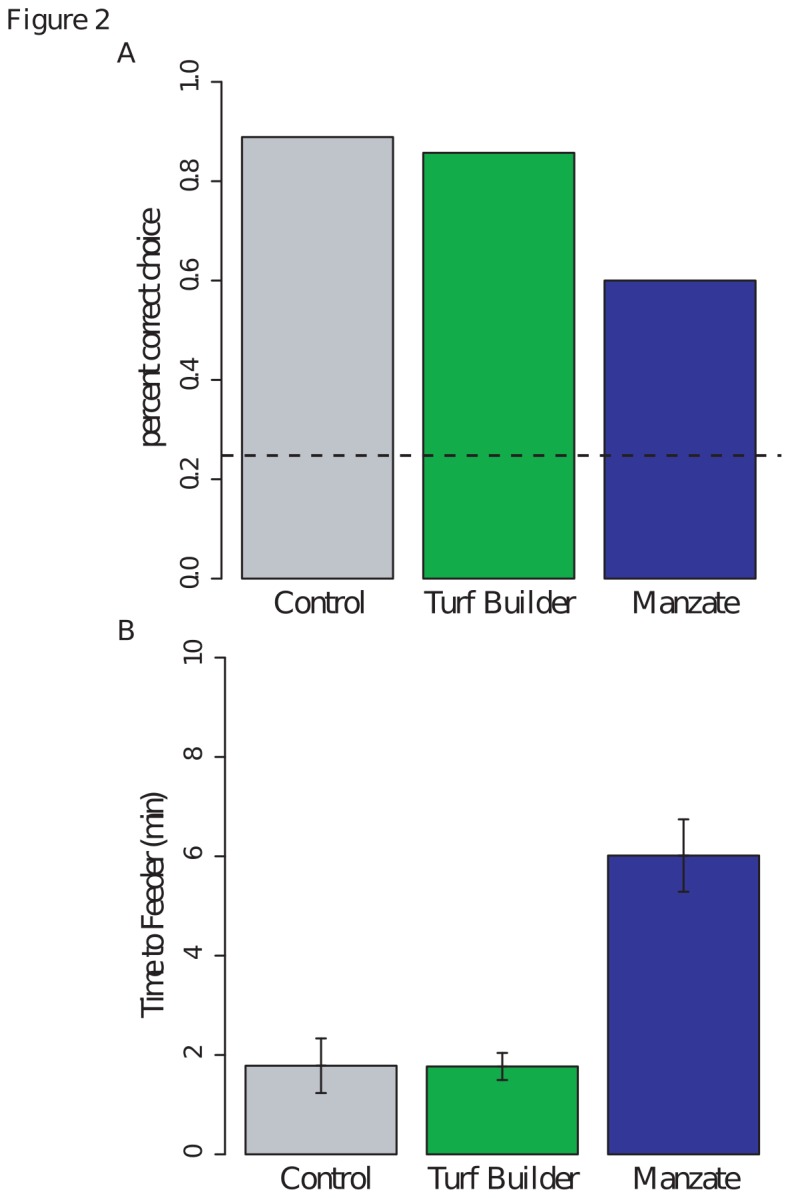
(a) The percentage of bumblebees within a treatment group that successfully located the feeder within the maze on their first try (success due to random chance is represented by the dashed line). All three treatment-groups performed significantly better chance [Binomial exact test, p=0.0001 (control, n=9), p=0.001 (Turf Builder, n=7), p=0.02 (Manzate, n=10)], but only the Manzate treatment group showed a significant decrease in performance when compared to control [Binomial exact test, p=0. 0356 (Manzate), p=1.0 (Turf Builder)]. (b) Bumblebees running through Manzate-permeated mazes took a significantly longer time to locate the feeders [ANOVA, Tukey’s HSD, p<0.001]. These data exclude incorrect choice events.