
Figure 3. Bumblebees preferred to feed in unpolluted environments.
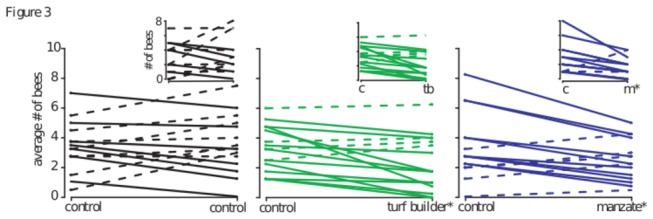
Data depicted compare the number of bees on the feeder in a control (unpolluted) chamber and a polluted chamber (Turf Builder or Manzate-permeated). Solid lines indicate decreasing trends (more bees in the control chamber), while dashed lines indicate increasing trends. The full size graphs show 60-minute averages. Both Turf Builder and Manzate treatment groups show a significant preference for the unpolluted condition [Wilcoxon signed rank test: p=0. 6462 (control, n=15), p= 0. 0079 (Turf Builder, n=16), p= 0. 0154 (Manzate, n=15)]. The insets show the 15-minute count, when the Manzate group is already showing a significant preference [Wilcoxon signed rank test: p= 0. 8438 (control, n=16), p= 0. 1449 (Turf Builder, n=17), p= 0. 0083 (Manzate, n=15)]. *p<0.05.