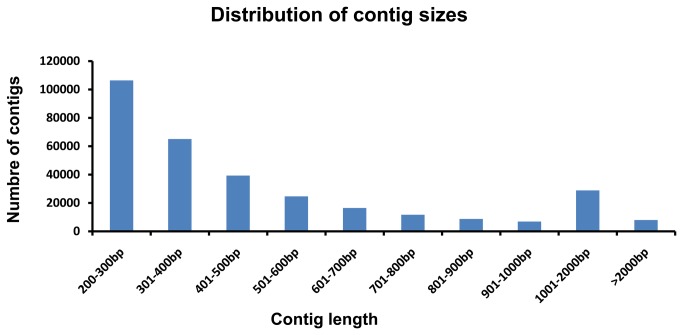
Figure 3. The distribution of contig sizes.
The X axis represents the length of sequence contigs, starting with 200-300 bp, since the minimum length of the contig is 200 bp, followed by 301-400 bp, 401-500 bp, 501-600 bp, 601-700 bp, 701-800 bp, 801-900 bp, 901-1000 bp, 1001-2000 bp and > 2000 bp. The Y axis represents the number of sequence contigs.

