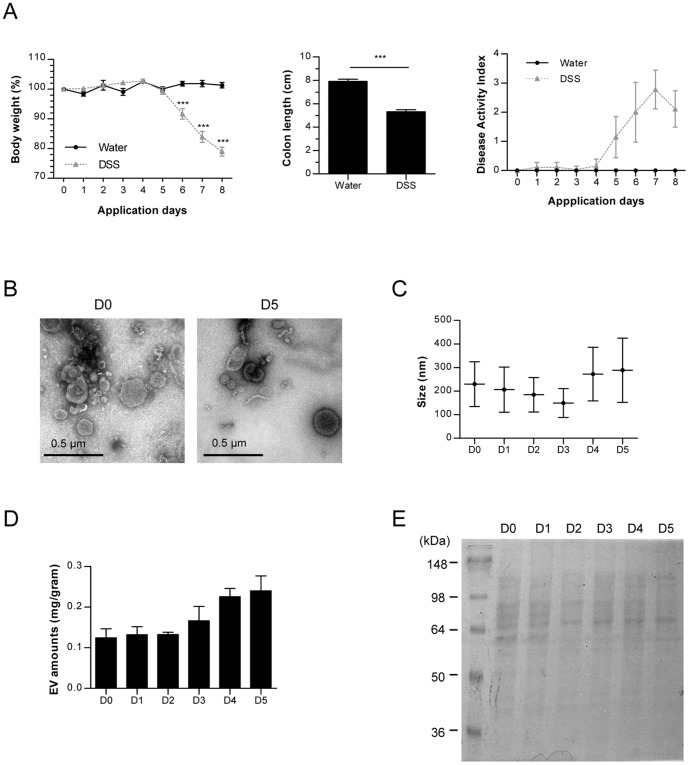
Figure 1. Characterization of stool EV from a DSS-induced colitis mouse model.
For all figures, C57BL/6 mice (each group = 5) were ingested by water or 3% DSS. (A) Body weight changes (%, left panel), colon length (middle panel), and disease activity index including body weight, colon length, diarrhea, and stool blood (right panel). Water: water-administered group; DSS: 3% DSS-administered group; *, p<0.05; ***, p<0.001. (B) TEM images (×80 k) of EV isolated from stools on days 0 and 5. D0; stools before DSS application; D5: stools 5 days after 3% DSS application. (C) EV sizes (d.nm) measured by nanoparticle tracking analysis (NTA) on day 0 through day 5. (D) EV extraction amounts (protein concentration per gram stool) from stools D0 – D5. (E) Protein profiles in EV (D0 – D5) through SDS-PAGE by using coomassie brilliant blue G250 dye.

