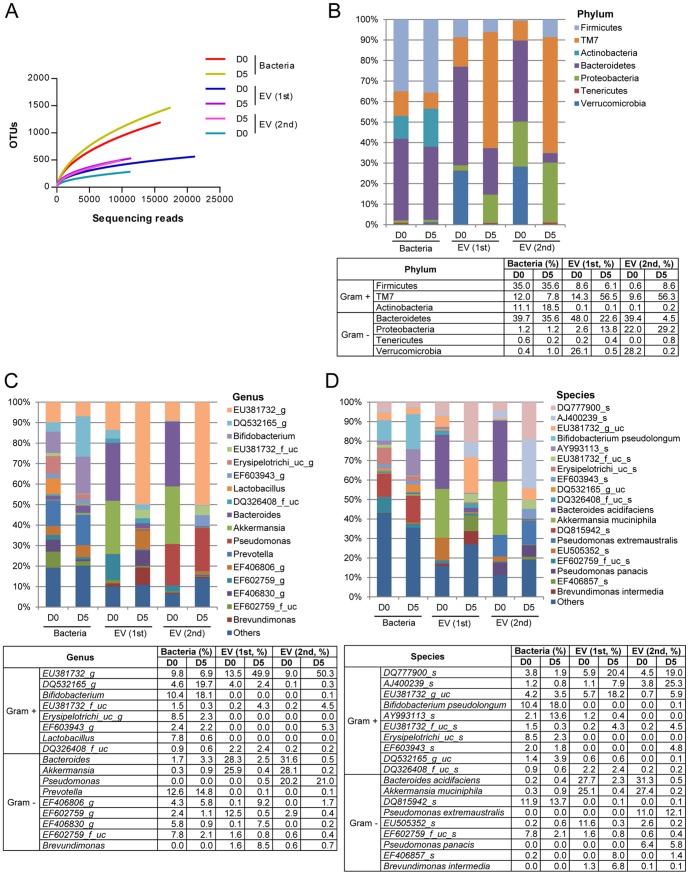
Figure 2. The composition of bacterial and bacteria-derived EV in stools following 3% DSS administration.
For all figures, stool bacteria and EV were isolated from mice before (D0) and 5 days (D5) after 3% DSS oral administration (each group = 5). As for EV metagenomics, two independent experiments were performed. (A) Operational taxonomic units (OTUs) using Roche 454 GS FLX Titanium. For figures (B)–(D), the proportion of stool bacteria and bacterial EV is displayed at the phylum (B), genus (C), and species (D) levels. As for genus and species, the proportion less than 1% occupancy is noted as others.

