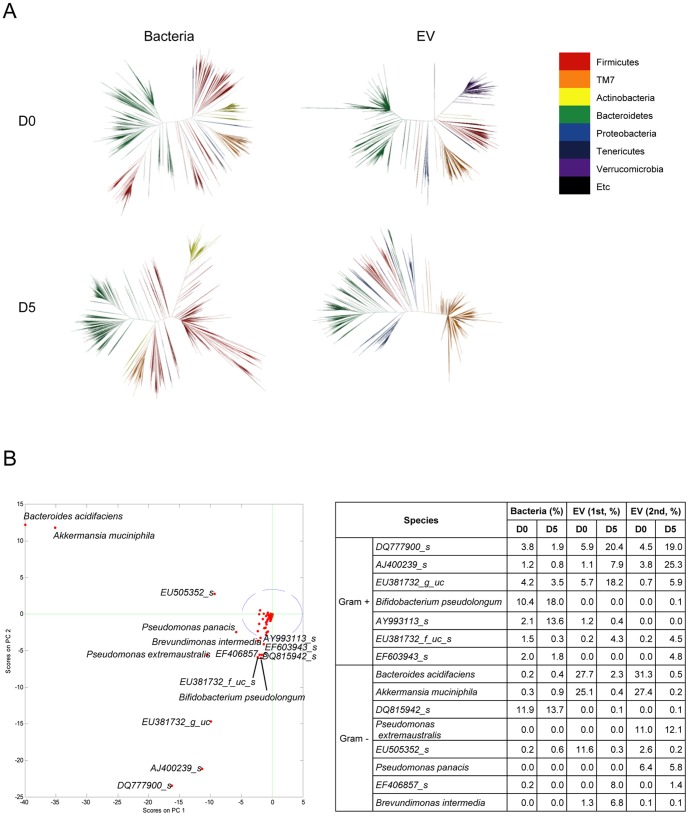
Figure 4. Change of stool bacteria and bacterial EV following 3% DSS administration.
For all figures, stool bacteria and EV were isolated from mice before (D0) and 5 days (D5) after 3% DSS oral administration (each group = 5). As for EV metagenomics, two independent experiments were performed. (A) Phylogenetic trees of stool bacteria and bacterial EV. (B) Principal component analysis (PCA) of bacterial EV (left panel) and changes of candidate bacteria and bacterial EV following 3% DSS administration (right panel). Blue circle means 95% confidence interval, and green cross means the starting point to diverge each species.

