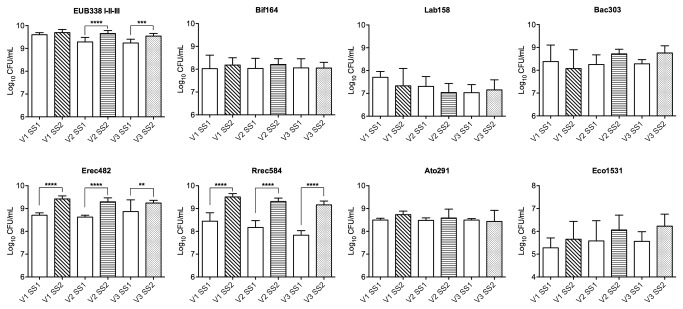
Figure 1. Bacterial populations.
Bacterial populations in the three different vessels (V1, V2 and V3) of the gut models before (SS1) and after (SS2) WD treatment. Data presented as means of the three gut models ± standard deviations. SS1 and SS2 are calculated as mean values over three consecutive days. ** P < 0.01, *** P < 0.001, **** P < 0.0001, significantly different from SS1.

