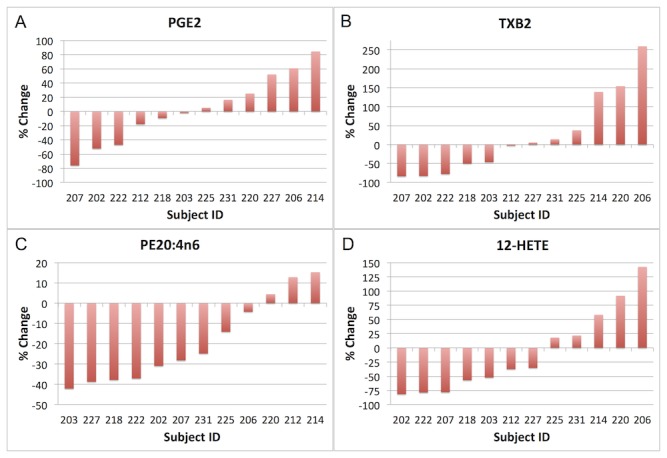
Figure 4. Bar graphs of each individual subject’s % change in the following arachidonic acid (ARA, 20:4n6) metabolites (subjects ordered by direction and magnitude of response on x axis): A) the cyclooxygenase (COX) metabolite prostaglandin E2 (PGE2); B) the COX metabolite thromboxane B2 (TXB2); C) ARA concentrations within the phosphatidylethanolamine (PE) lipid class; and D) the lipoxygenase metabolite 12-hidroxyeicosatetraenoic acid (12-HETE).

