
Figure 3. Exendin-4 prevents apoptosis induced by t-BHP.
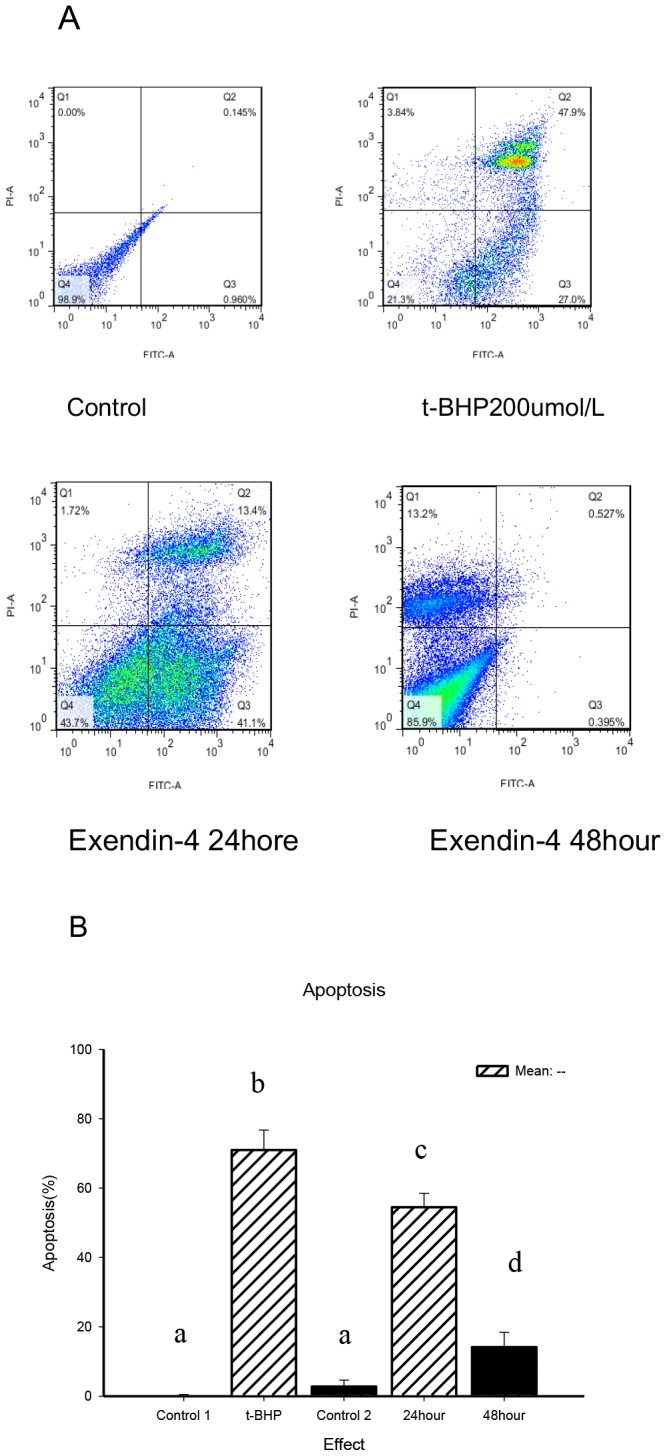
A, FACS analysis of apoptosis. Min6 cells were divided into four groups: control, t-BHP (200 µM for 24 hours), Exendin-4 (100 µM for 24 hours) and Exendin-4 (100 µM for 48 hours). Before being treated with t-BHP, the cells were treated with Exendin-4 for 24 or 48 hours). The cells were collected and stained with Annexin V and PI and analyzed by FACS. Figure B presents a summary of the results and includes a comparison of the apoptosis percentages of early-stage and late-stage. The data are expressed as the means±S.D. (n = 6). a, b, c and d indicate the blank control, t-BHP (200 µM for 24 hours), Exendin-4 (100 µM for 24 hours) and group comparisons with the Exendin-4 (100 µM for 48 hours) group (p<0.05).