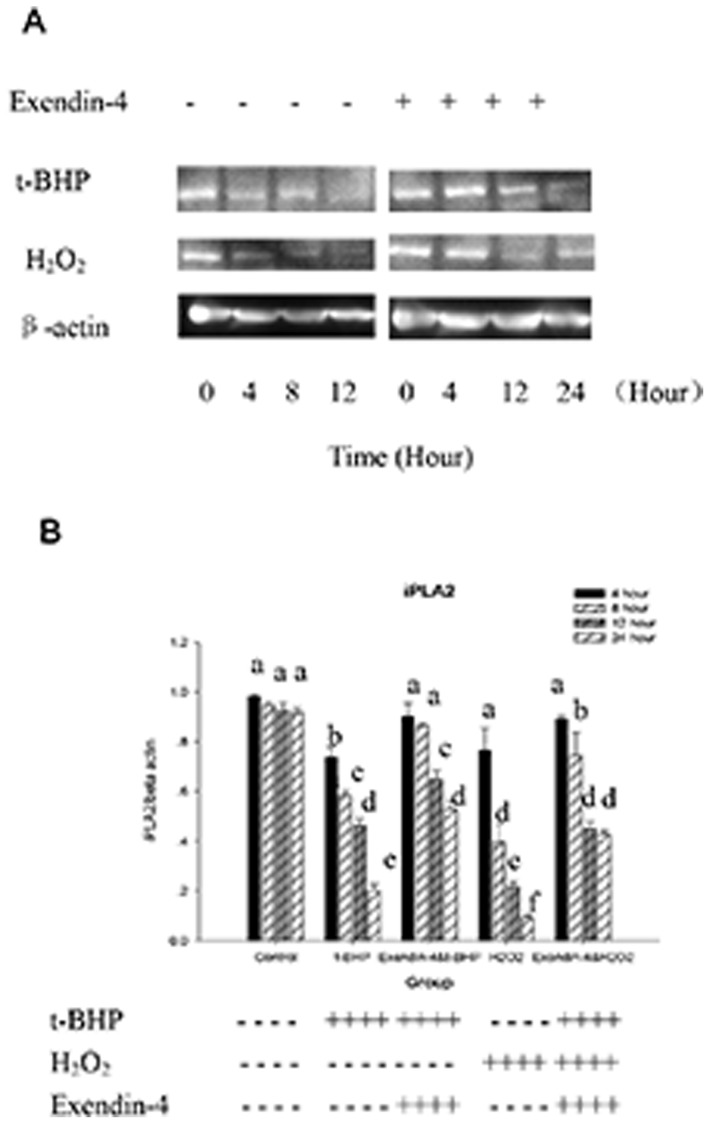
Figure 13. iPLA2 expression is downregulated in t-BHP-induced apoptosis.
Figure A, Western blot analysis of iPLA2 expression during t-BHP-induced apoptosis. The cells were first treated with or without Exendin-4 and then with t-BHP (200 µM for 24 hours) or H2O2 (100 µM for 12 hours) for different intervention times. The cells were then collected, and cell lysates were prepared and analyzed for iPLA2 and actin. B, the group gray comparison. Data are expressed as the means±S.D. (n = 6). a, b, c, d, e and f indicate group comparisons (p<0.05).

