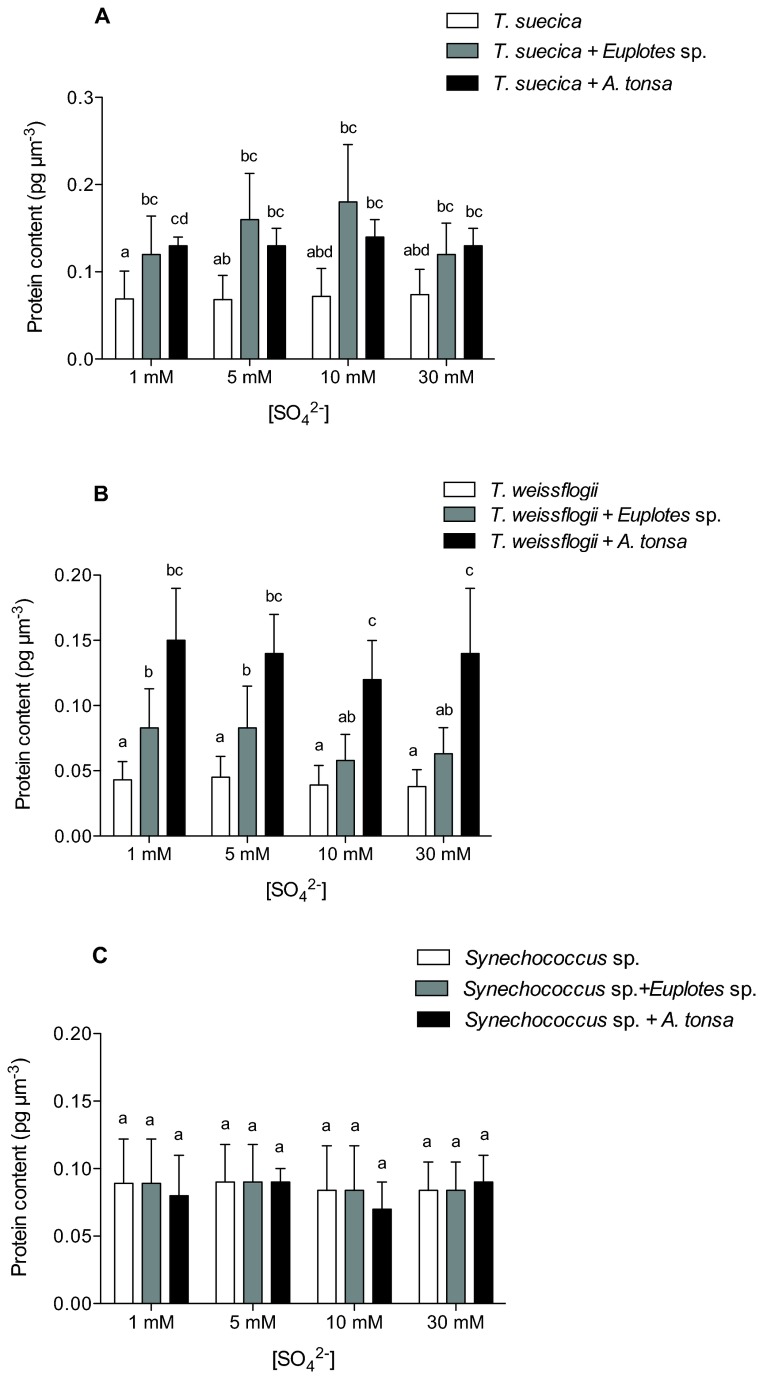
Figure 2. Effect of grazers on algal protein content.
Protein content of (A) T. suecica, (B) T. weissfloggi, and (C) Synechococcus sp. cells cultured at 1 mM, 5 mM, 10 mM or 30 mM SO4 2- and in the presence of Euplotes sp. or A. tonsa. Error bars represent standard deviation calculated for at least four independent replicates. Histograms on top of which the same letter appears represent means that are not statistically different; different letters identify means that are significantly different (p > 0.05).

