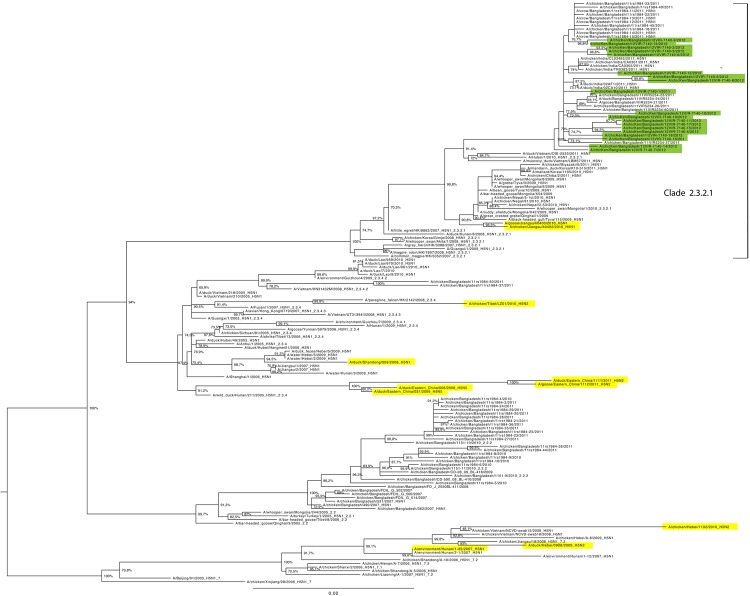
Figure 1.
Maximum-likelihood phylogenetic tree for the hemagglutinin gene segment of avian influenza (H5N1) viruses from Bangladesh compared with other viruses. Green shading indicates viruses from Bangladesh sequenced and characterized in this study; yellow shading indicates previously described subtype H5N1/H9N2 reassortant influenza viruses (8,9) or those from GenBank. Numbers at the nodes represent bootstrap values. Scale bar indicates nucleotide substitutions per site.

