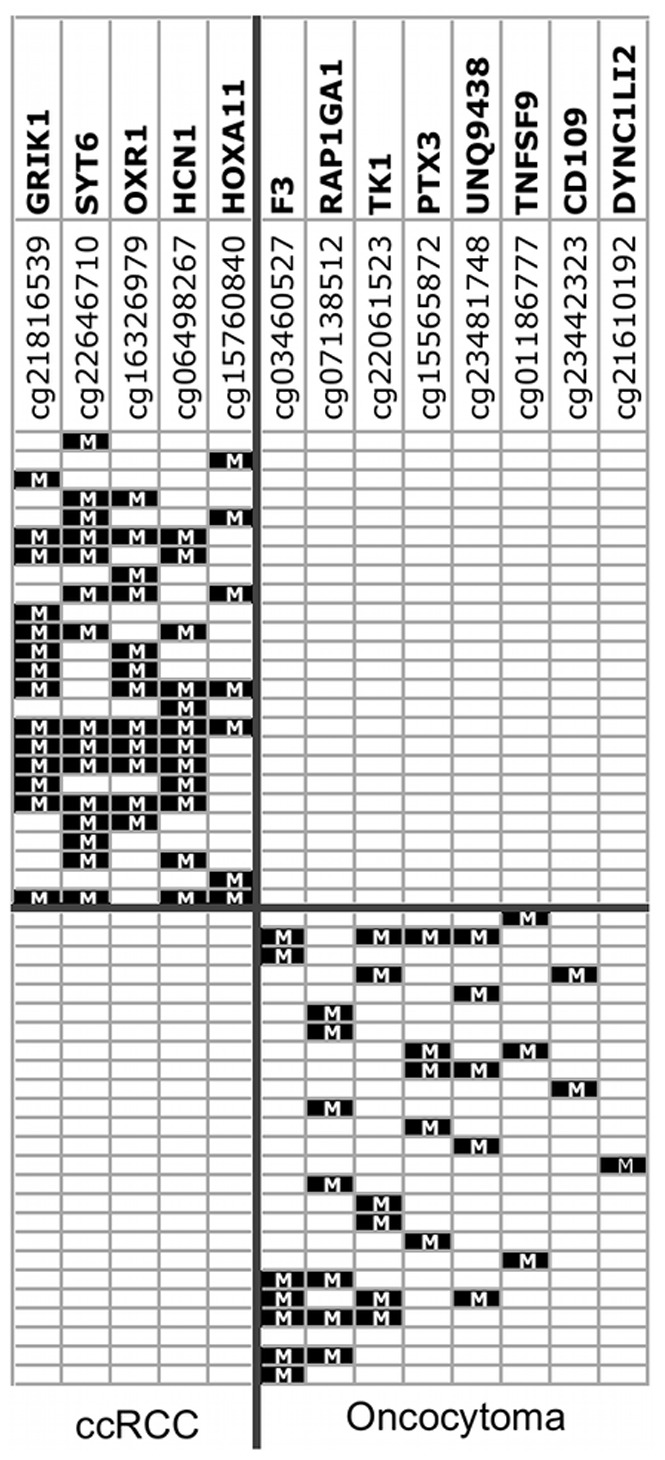
Figure 6. Barplots of genes differentially methylated between tumor types.

Y axis is Infinium β-value. For each gene, tumors above the horizontal blue line (delta β 0.2> mean of comparison tumor type) are hypermethylated in the tumor type but unmethylated (β<0.15) in the comparison tumor type.
