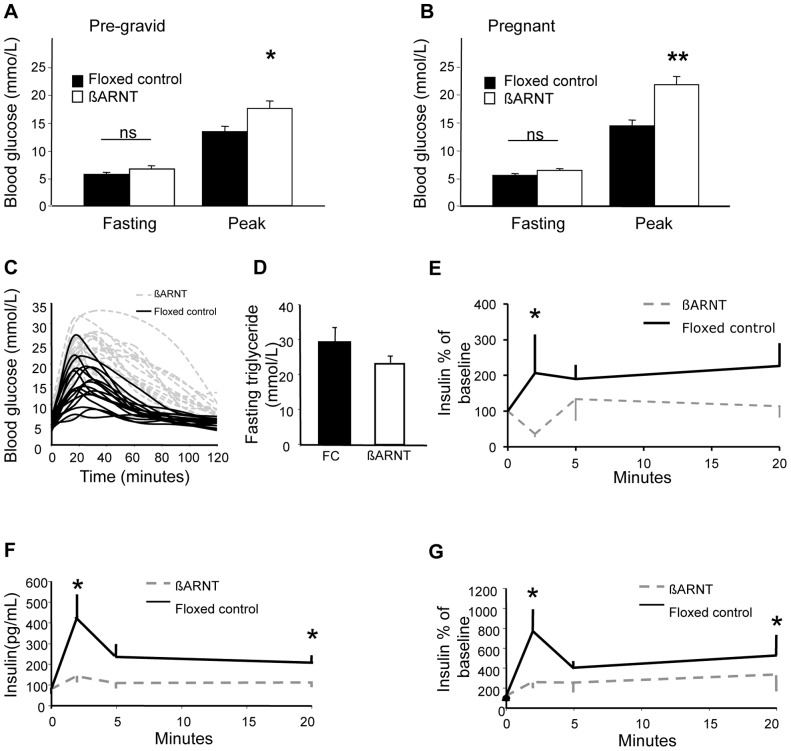
Figure 2. Glucose metabolism in ß-ARNT and floxed control females.
(A) Pre-gravid fasting and peak blood glucose levels in ß-ARNT (n = 19) and floxed control (n = 19) females. *p<0.05, t-test. Bars represent mean±SEM. (B) Late gestational fasting and peak blood glucose levels in ß-ARNT (n = 19) and floxed control (n = 19) females. **p<0.01, t-test. Bars represent mean±SEM. (C) Glucose tolerance curves for ß-ARNT and floxed control pregnancies. Each curve represents an individual mouse. (D) Fasting triglycerides in pregnant ß-ARNT and floxed control (FC) females. Bars represent mean±SEM. (E) Decreased first phase insulin secretion in non pregnant ß-ARNT versus floxed control females. *p<0.05. Data points represent mean±SEM. (F) Decreased first and second phase insulin secretion in pregnant ß-ARNT (n = 12) versus floxed control (n = 14) females. Insulin expressed in absolute values. *p<0.05. Data points represent mean±SEM. (G) Decreased first and second phase insulin secretion in pregnant ß-ARNT versus floxed control females. Insulin expressed as percentage of baseline. *p<0.05. Data points represent mean±SEM.

