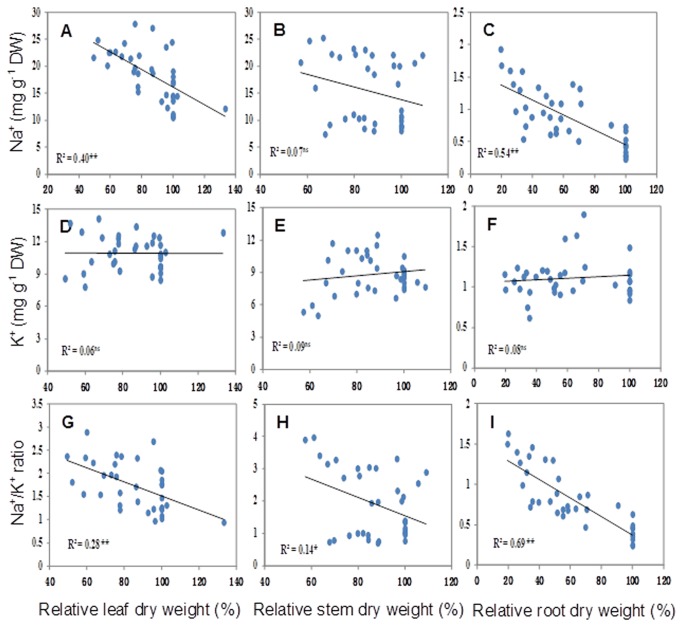
Figure 2. The correlation between relative dry weight and ionic concentration.
The correlation between Na+, K+ concentration and Na+/K+ ratios and relative leaf (A, D and G), stem (B, E and H) and root (C, F and I) dry weight based on three genotypes: CM72, XZ16 and XZ5. ns’ not significant, * and ** indicate significant at 0.05 and 0.01, respectively.

