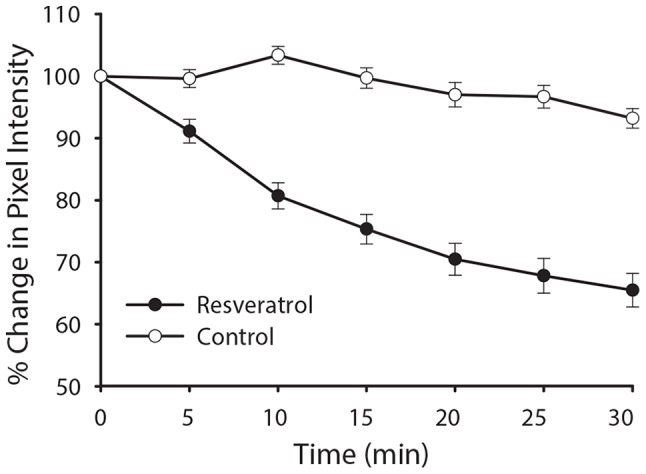
Figure 4. Time course of PI [3], [4], [5]P depletion from plasma membrane of mpkCCDc14 cells parallels change in ENaC current.

The percent change of average pixel intensity of GFP-AKT-PH in cells treated with resveratrol (closed circles) versus vehicle treatment (open circles) is plotted against time. Decay of plasma membrane PI [3], [4], [5]P levels within 10 min of application. Graph shows mean ± SEM; N = 10; *p<0.05).
