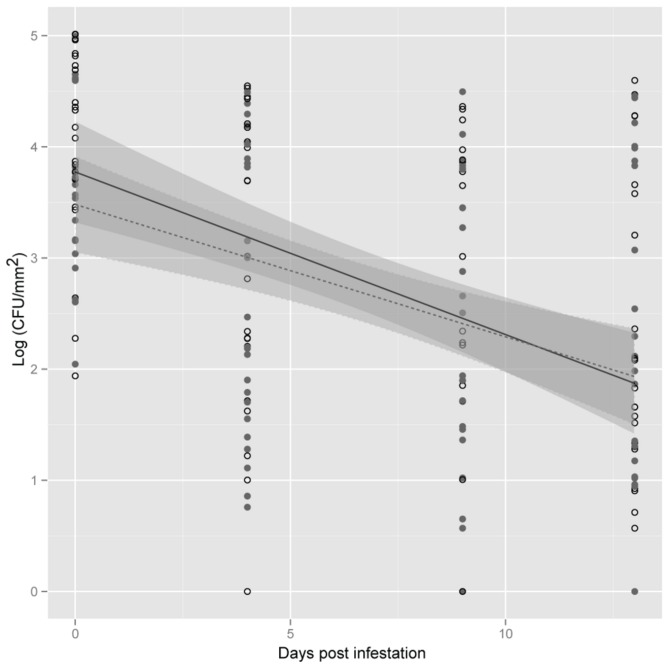
Figure 1. Salmonella enterica population dynamics on plants exposed to Frankliniella occidentalis.
Lettuce plants were exposed (open circles) or non-exposed (close circles) to F. occidentalis. Shown is the mean log population of S. enterica on lettuce leaf samples (CFU/mm2) at 0, 4, 9 and 13 days post infestation. The data represent the means of three independent experiments. Lines (black, exposed; dotted, non-exposed) correspond to a linear regression model, and shaded areas to their associated 95% confidence interval.

