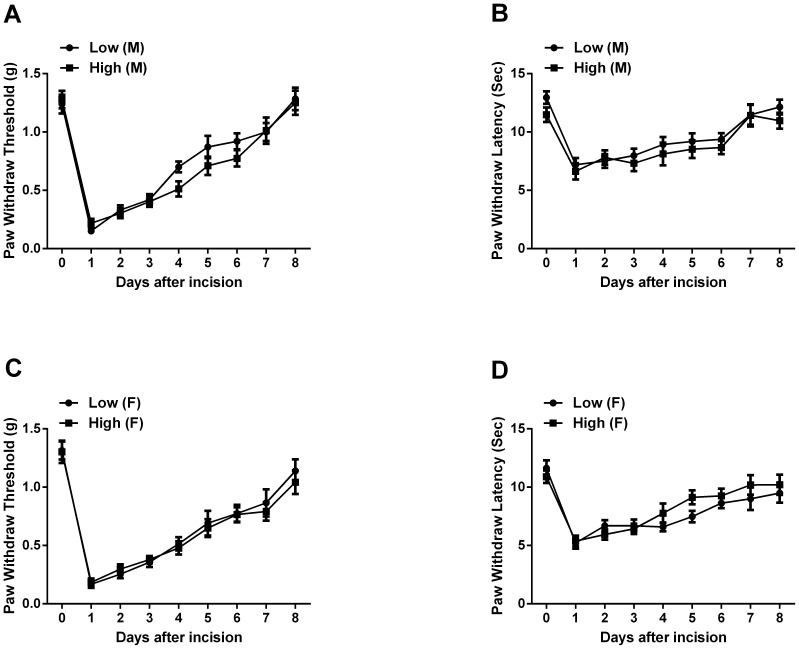
Figure 3. Mechanical and thermal nociceptive sensitivity for mice fed high versus low methyl donor diets after weaning.
In panels A and B the mechanical and thermal sensitivity are displayed for male. Panels C and D the mechanical and thermal sensitivity are displayed for female. Values are displayed as the mean ± SEM. n = 8/group. M, male; F, female.

