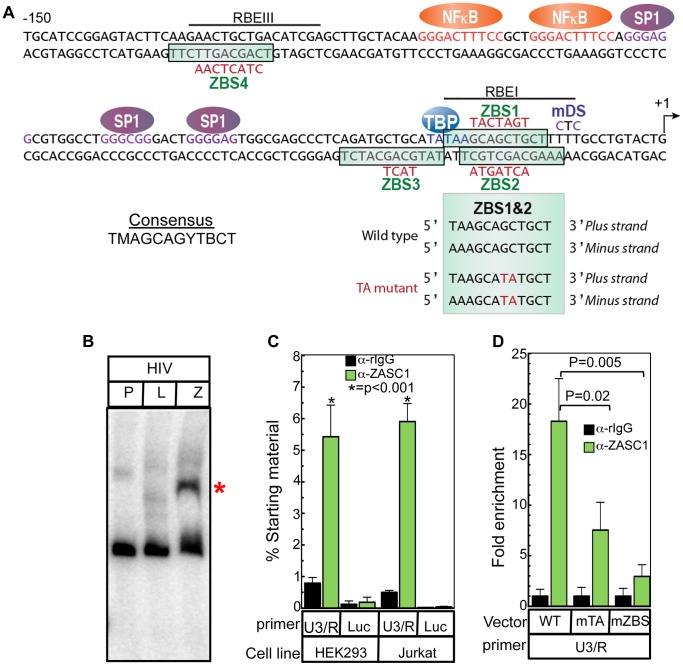
Figure 1. ZASC1 binds to specific DNA elements in the HIV-1 promoter and regulates viral transcription.
(A) Sequence of the HIV U3 region from −150 to +1 of HIV-1 isolate NL43 showing the relative location of the four putative ZBS. Known transcription factor binding sites are indicated as follows: NFκB (orange), SP1 (purple), TBP (blue) and the Ras-responsive binding elements (RBE) RBEI and RBEIII (underlined). Mutations that were introduced in the ZBS are indicated in red. A control downstream mutation (mDS) is indicated in purple. Alignment of ZBS 1 and 2 indicating the 2 bp offset palindromic structure and the GC to TA mutation introduced into the site that alters the same bases on both strands is shown below the promoter sequence. (B) EMSA of the WT HIV U3 DNA probe (nucleotides −454 to +66) alone (P) or incubated with in vitro transcribed/translated luciferase (L) or ZASC1 (Z) proteins. (C) Total ZASC1 bound to the HIV promoter was measured by chromatin immunoprecipitation with an anti-ZASC1 antibody on HEK293 or Jurkat cells transduced with NL43E-R-Luc using a primer set that spans the ZBS at the U3/R boundary (−116 to +25) or a primer that amplifies the luciferase gene in the nef locus located approximately 9 kBp downstream from the transcription start site. Real-time PCR analysis was performed in triplicate and normalized to input controls. (D) ChIP assays of ZASC1 recruitment to the HIV-1 promoter in Jurkat cells transduced with similar levels of NL43E-R-Luc or modified viral constructs containing the TA mutation or the mutation of all four ZBS (Fig. 1A). Immunoprecipitation and Real-time PCR analysis was performed in triplicate and normalized to input controls and is reported as fold-enrichment relative to control pull-downs with non-specific rabbit IgG. The data shown are the average mean values obtained in an experiment performed with quadruplicate samples and each is representative of three independent experiments. Error bars indicate the standard deviation of the data in all panels. P-values were calculated using a standard Student's t-test and significant changes relative to WT or relevant bracketed comparisons indicated.

