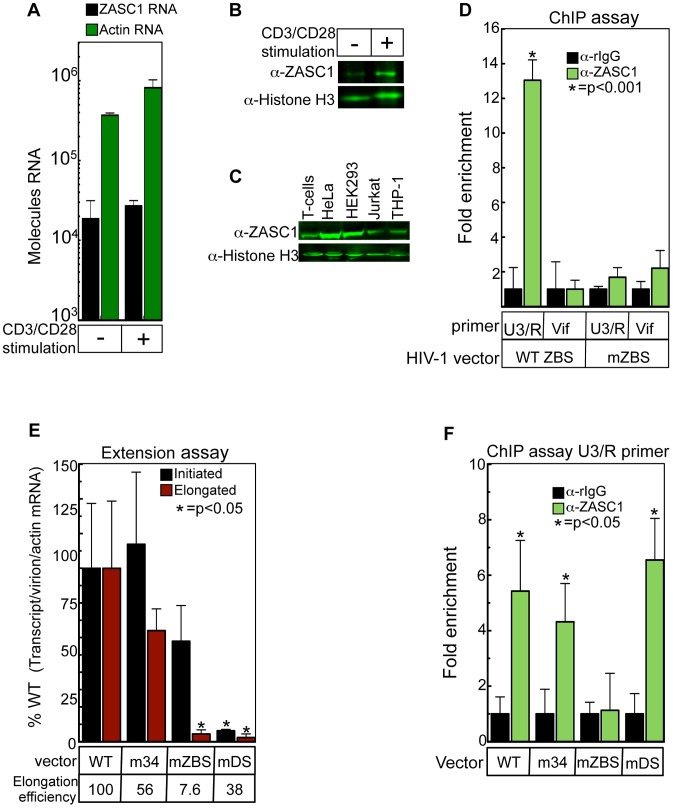
Figure 4. ZASC1 stimulates transcription elongation from the HIV-1 promoter in primary T-cells.
(A) Isolated CD4+ were placed in culture and stimulated for 24 hrs with CD3/CD28 beads, total RNA was isolated from cells (1×10⁵) and expression of ZASC1 and actin was monitored by quantitative real-time RT-PCR. (B) Unstimulated or CD3/CD28 stimulated primary T-cells (1×10⁶) were harvested and analyzed by immunoblotting with anti-ZASC1 and anti-Histone H3 antibodies. (C) Cells (1×10⁶) from CD3/CD28 stimulated primary T-cells or the indicated cell lines were harvested and analyzed by immunoblotting with anti-ZASC1 and anti-Histone H3 antibodies. A representative blot of three independent experiments is shown (D) Stimulated primary T cells were challenged with either WT NL43-luc or mZBS mutant and 2 dpi, total ZASC1 bound to the HIV promoter was measured by chromatin immunoprecipitation with an anti-ZASC1 antibody using a primer set that spans the ZBS at the U3/R boundary (−116 to +25) or a primer that amplifies the vif locus located approximately 5 kBp downstream from the transcription start site. Real-time PCR analysis was performed in triplicate and normalized to input controls and fold enrichment relative to rabbit IgG controls reported. (E) The amount of initiated and extended transcripts was assayed in stimulated primary T-cells challenged with NL43E-R-Luc or ZBS variants by isolating total RNA 48 hpi and performing real-time reverse transcription as described in Fig. 3B. Transcript values were normalized for the amount of input virion RNA and total cellular actin mRNA. Real-time PCR was performed in triplicate. Elongation efficiency was determined by dividing the extended transcripts by the total initiated transcripts with WT efficiency set at 100%. (F) Stimulated primary T-cells were challenged with the indicated NL43-Luc variants and 2 dpi total ZASC1 bound to the HIV-1 promoter was determined by ChIP analysis as in C. Error bars indicate the standard deviation of the data and are representative of three independent experiments. P-values were calculated using a standard Student's t-test.

