
Figure 2. Comparing experimental and calculated relative binding free energies.
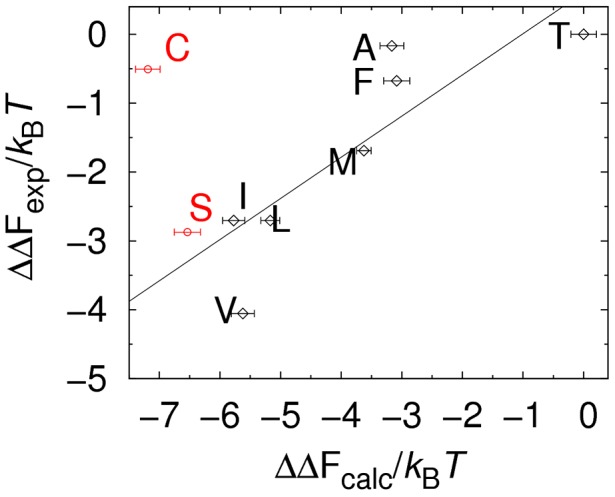
As a quantitative test of the all-atom model [36] used in this work, we calculate binding free energies,  , for the protein PSD95 and 9 different peptide sequences. The
  values were obtained from protein-peptide binding simulations performed separately for each PSD95-peptide pair according to our previous protocol [35], [36] (see also Methods) and using Equation 2. The peptide sequences considered are derived from KKETEV (black diamond) and are either
  -variants, KKETE-[I/L/M/F/A/T], (black diamonds) or
  -variants, KKE[S/C]EV (red circles). All simulations were performed at
  and standard errors were estimated from 10 independent runs. Experimental binding free energies,
  , are taken from Ref. [46]. Both
  and
and  values are shown relative to the weakest binding peptide. The solid line represents the best linear fit, exluding KKECEV, and the correlation coefficient is
  .
.