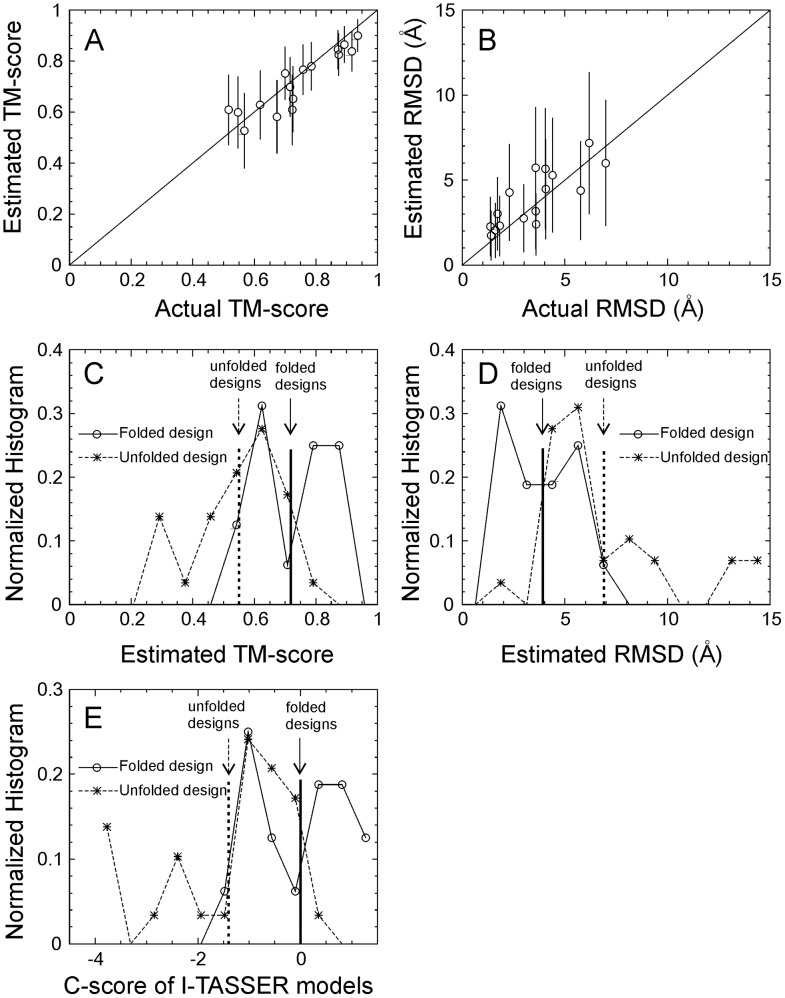
Figure 2. Results of I-TASSER folding on 45 sequences from previous protein design experiments [18], [39]–[51].
(A, B) Estimated TM-score and RMSD of the I-TASSER predicted models versus the actual TM-score and RMSD of the models to the experimental structure for the 16 folded designs. The estimation is calculated based on C-score with an error bar obtained from large-scale benchmark data [52]. (C, D, E) Histogram distributions of estimated TM-score and RMSD, and C-score of the I-TASSER predictions for 16 folded sequences (open circles and solid lines) and 29 unfolded sequences (stars and dashed lines). The vertical lines mark the average values for the folded and unfolded sequences respectively.

