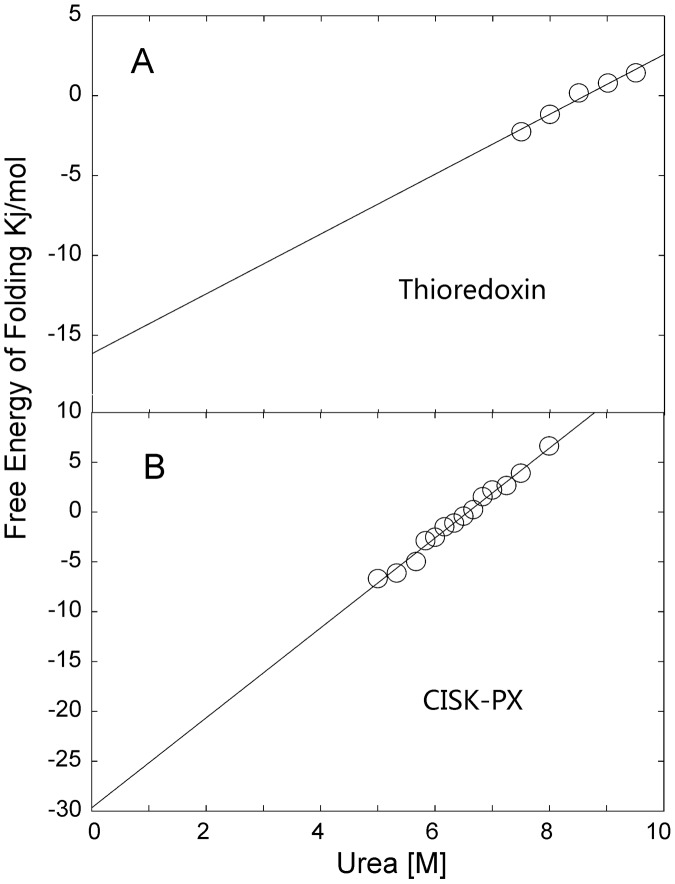
Figure 8. Free energy of folding was determined by circular dichroism.
(A) thioredoxin; (B) CISK-PX domains. The figure plots free energy (kJ/mol) versus the concentration [M] of chemical denaturant urea. The unfolding assay was conducted in 25 mM NaPO4, 150 mM NaF, pH 7.5 with 2–3 uM protein concentration and 0–9.5 M urea concentrations at 298 K. The free energies of folding are equal to the intercept through linear regression [76].

