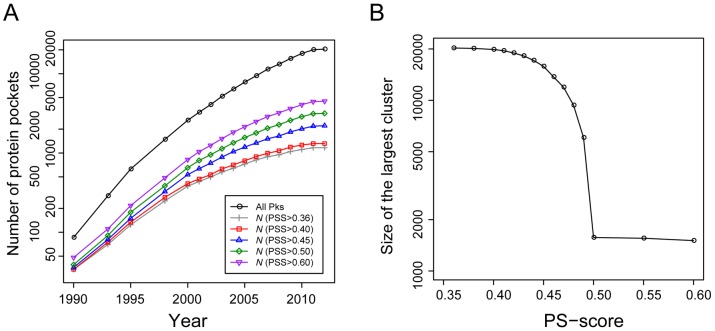
Figure 2. Representative protein pockets for ligand-binding in the PDB.
(A) Number of representative pockets versus year. “All Pks” denotes all 20,414 non-redundant pockets collected from the PDB up to May, 2012. The number of representative pockets was obtained by finding the smallest dominating set of all pockets at a specified PS-score (PSS) and a significant P<0.01. The number of pockets is shown on a logarithmic scale. (B) Size of the largest cluster of pockets at different PS-scores. Each PS-score threshold defines a graph representing the structural relationships of pockets. In each graph, the largest cluster forming the LSCC is then identified, and the size of the LSCC is plotted against the PS-score threshold.

