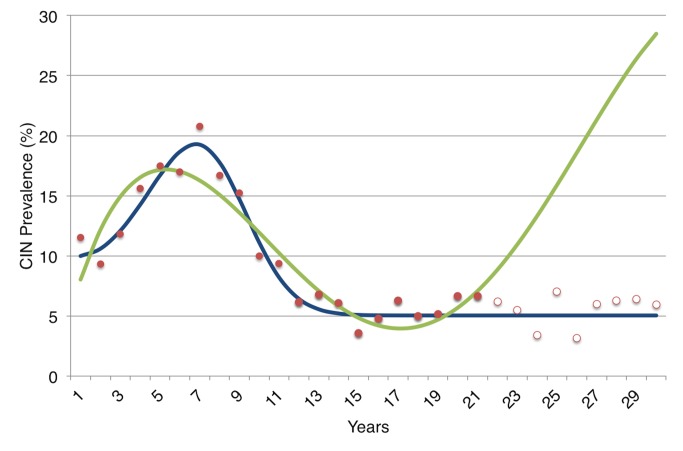
Figure 3. An illustration of the danger of overfitting a model to data in a theoretical demonstration.
We first generated data describing the prevalence of all cervical intraepithelial neoplasia (CIN) lesions over a 30-year period among a fictional cohort of young women. To do so, we used the more “realistic” (complex) model in Figure 2 and assigned typical parameter values for the rates of progression and regression between states (a 5% rate of progression to the next state and 50% rate of regression per year to the prior state), then added noise to the data by drawing randomly from a normal distribution with mean equal to average prevalence and standard deviation corresponding to the prevalence rate's standard deviation. We performed a common model “calibration” approach in which both the simple and complex model shown in Figure 2 were fitted to the first 20 years of the data (solid red dots), starting from standard parameter uncertainty ranges for progression and regression of disease [29]. Despite being the “real” model, the more complex model had numerous alternative parameter values fit the data, since there are so many uncertainties about the progression and regression rates that many combinations of parameters were able to produce reasonable fits. As shown, one of these fits (green) produced a pattern that poorly forecast future prevalence (hollow red dots) despite fitting the earlier prevalence data (solid red dots). The more complex model (in green) actually has a better “fit” to the early prevalence data when judged by standard reduced chi-squared criteria than does the simpler model (in blue); but as illustrated here, it has substantially poorer performance in forecasting prevalence in future years. The more complex model did not perform poorly simply by chance; it did so because there was insufficient prior knowledge to inform the parameter values describing the process of progression and regression through pre-cancerous states, hence the model was susceptible to fitting too tightly to the noisy prevalence data (overfitting).

