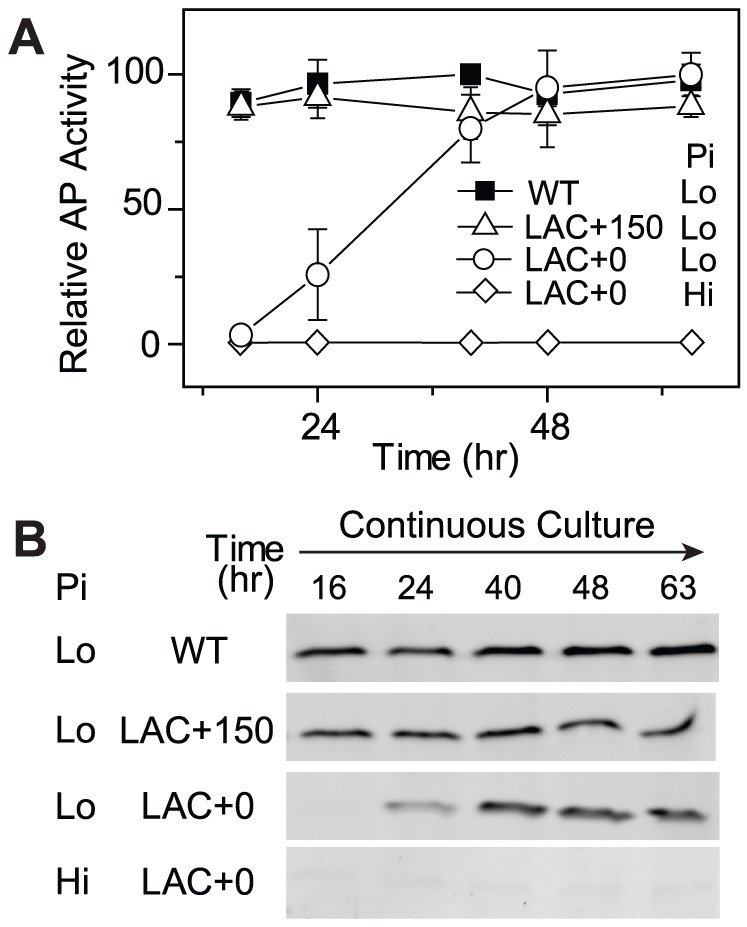
Figure 4. Cells expressing low levels of PhoB adapt to Pi-deplete environments by increasing PhoB expression.

Time-dependent AP activities (A) and PhoB levels (B) are shown for continuous cultures with indicated strains, BW25113 (WT) and RU1616 (LAC). Pi concentrations of 300 µM (Hi) and 12 µM (Lo) in the inlet fresh medium were used for Pi-replete and -deplete environments, respectively. Numbers after the “+” sign indicate IPTG concentrations. 0.3 OD600*ml of cells collected from the chemostat outlet flow were used for analyses of AP activities and PhoB expression. Error bars are SDs of three independent experiments and unseen error bars are smaller than symbols.
