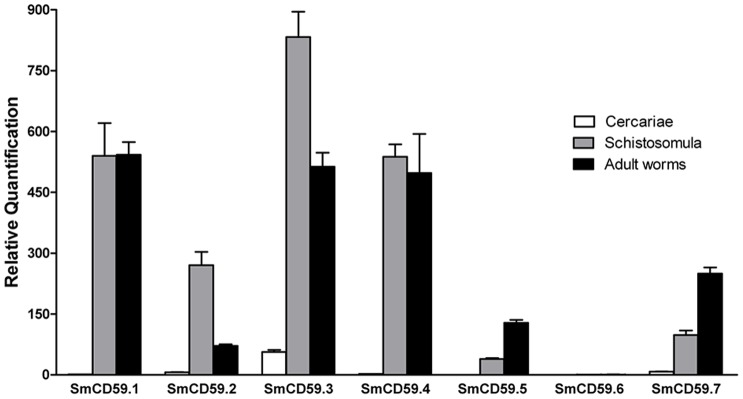
Figure 3. Relative expression levels in different SmCD59 isoforms.

Relative gene expression levels for each homologue was determined by qRT-PCR and represented as mean (+ SD) from technical triplicates. The developmental stages examined were cercariae, schistosomula (11-day cultured), and adult pairs (6-week old).
