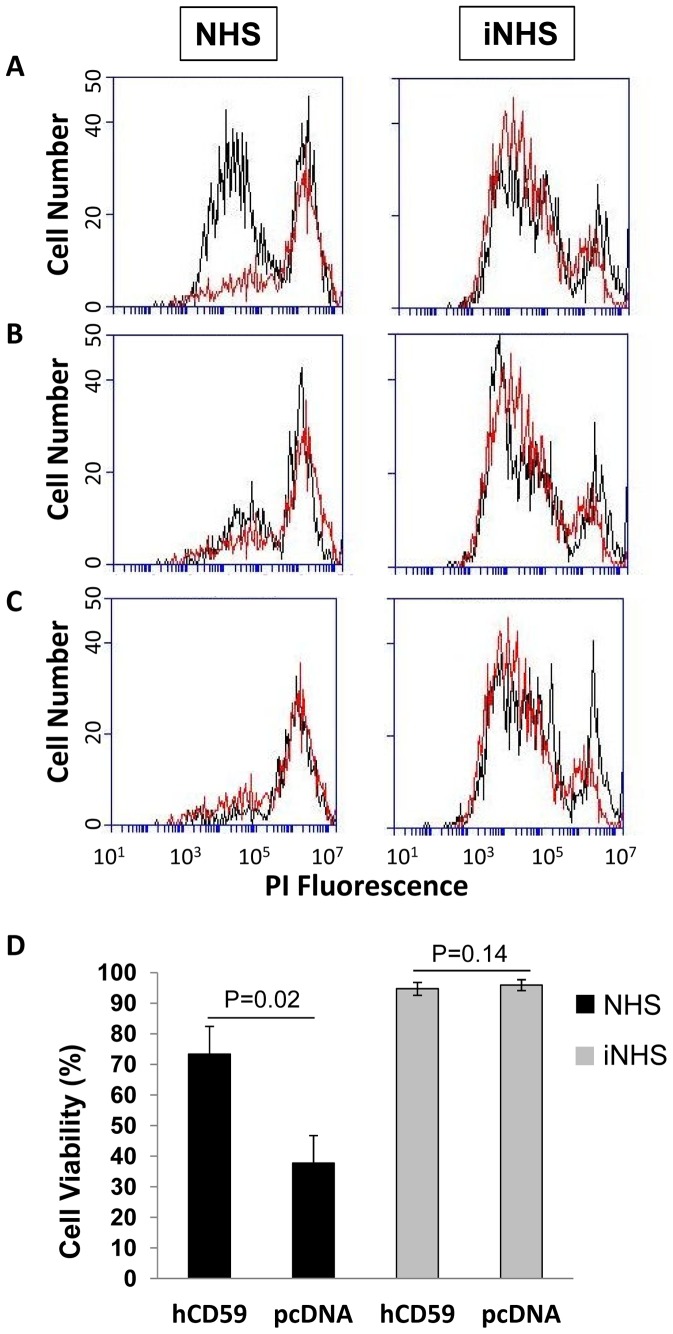
Figure 7. Complement resistance of CHO cells expressing SmCD59.1, SmCD59.2 and hCD59 (positive control).
Viable cells were quantified by flow cytometry following exposure to anti-CHO antibodies and normal human serum (NHS) or heat-inactivated serum (iNHS). Black histograms are CHO cells transfected with hCD59 (A), SmCD59.1 (B) or SmCD59.2 (C), respectively. Red histograms are control cells transfected with empty pcDNA vector (A, B and C). The first peak in both black and red histograms represents viable cells and the second peak represents dead cells stained by propidium iodide (PI). (D) Cell viability of CHO cells transfected with hCD59 or pcDNA treated with anti-CHO antibodies and NHS or iNHS in three independent experiments (mean ± SD). P values are indicated.

