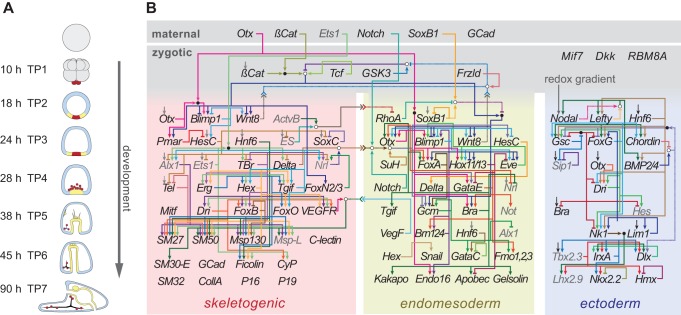
Figure 1. Developmental gene regulatory network of S. purpuratus.
(A) Development progresses from the egg (top), through cleavage and gastrulation (middle), to a free living larva capable of feeding (bottom). Skeletogenic cell lineage indicated in red, skeleton in solid black. The seven post-fertilization stages and times (hours) shown correspond to time points 1–7 discussed throughout this article. (B) The gene regulatory network is initiated by maternal transcripts and proteins (top) that activate a cascade of subsequent gene regulatory interactions (see text for references). Names of genes assayed in this study are shown in black, other genes in gray. Solid lines, colored to allow visual separation, denote experimentally verified direct molecular interactions among genes: transcription factor:DNA binding (arrows = activators, bars = repressors) or ligand:receptor interactions (nested arrowheads pointing to receptor). Distinct spatial territories of cell fates specific in the embryo are indicated by colored background and name. Based on [13]–[24].

