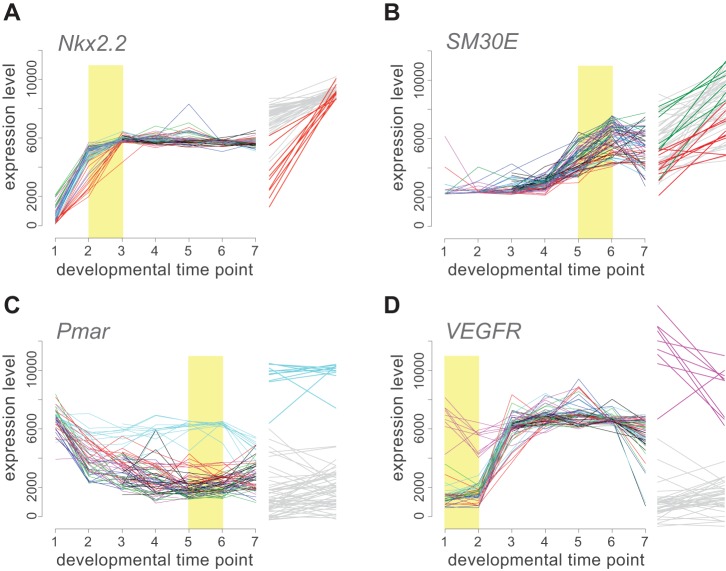
Figure 2. Parent-of-origin effects on gene expression profiles.
Changes in transcript abundance across seven developmental stages are plotted for each family for four representative genes. Families are color-coded by parent of origin: dam in (A, C, D) and sire in (B). In each case, gene expression profiles in the families derived from one parent stand out as distinct from all the other families (color versus grey in magnified time segments to the right of each plot; yellow rectangles indicate magnified portion).

