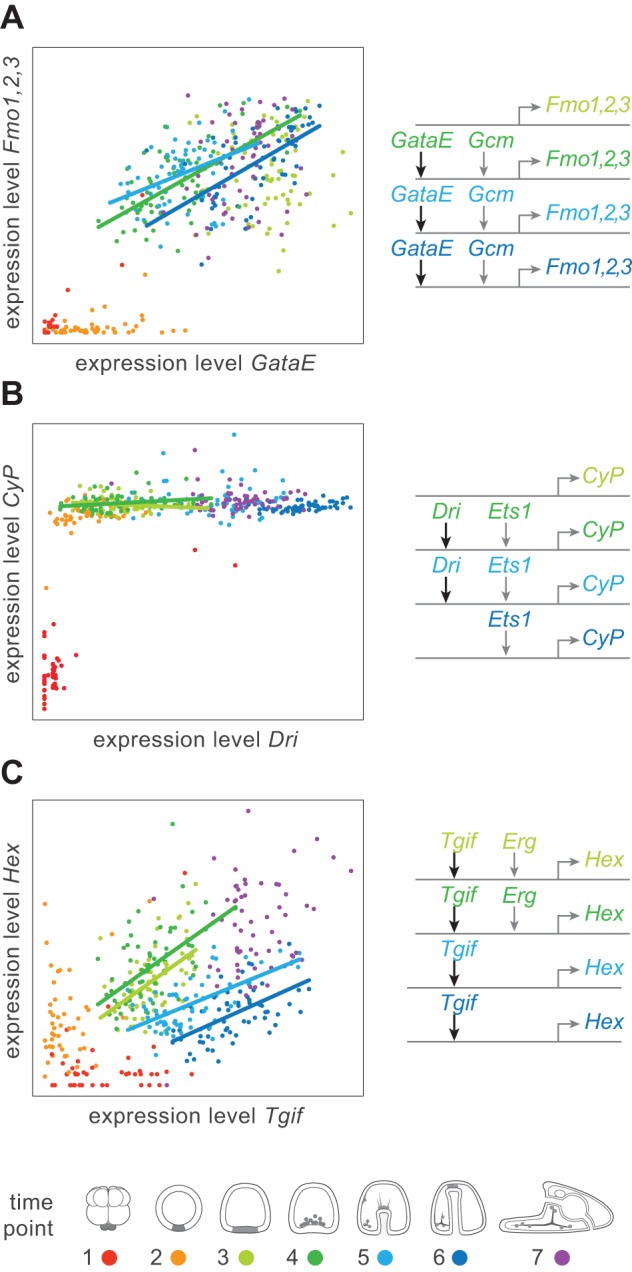
Figure 5. Correlations in gene expression levels among direct interactors.

Scatter plots of expression levels for pairs of upstream regulators (x-axis) and direct targets (y-axis). Expression levels and regulatory interactions are color-coded by developmental time point (bottom). Regression lines are shown at active time points. Regulatory inputs to the downstream gene at active time points are drawn to the right of each plot using the same color-coding for time points. Information about active/inactive edges is not available for time point 7, which is therefore omitted. Note that gene regulatory interactions differ qualitatively. (A) Some are roughly linear: increased expression of the upstream gene (GataE) is correlated with increased expression of its direct target (Fmo1,2,3). (B) Other interactions are more switch-like: beyond a certain level, differences in expression of the upstream gene (Dri) has little impact on the expression level of its direct target (CyP). (C) Regulatory interactions can also change during development. Expression of Hex is sensitive to Tgif expression levels during all four active time points, but is more sensitive (steeper slope) when also receiving input from Erg (time points 3 and 4) than when it is not (time points 5 and 6).
