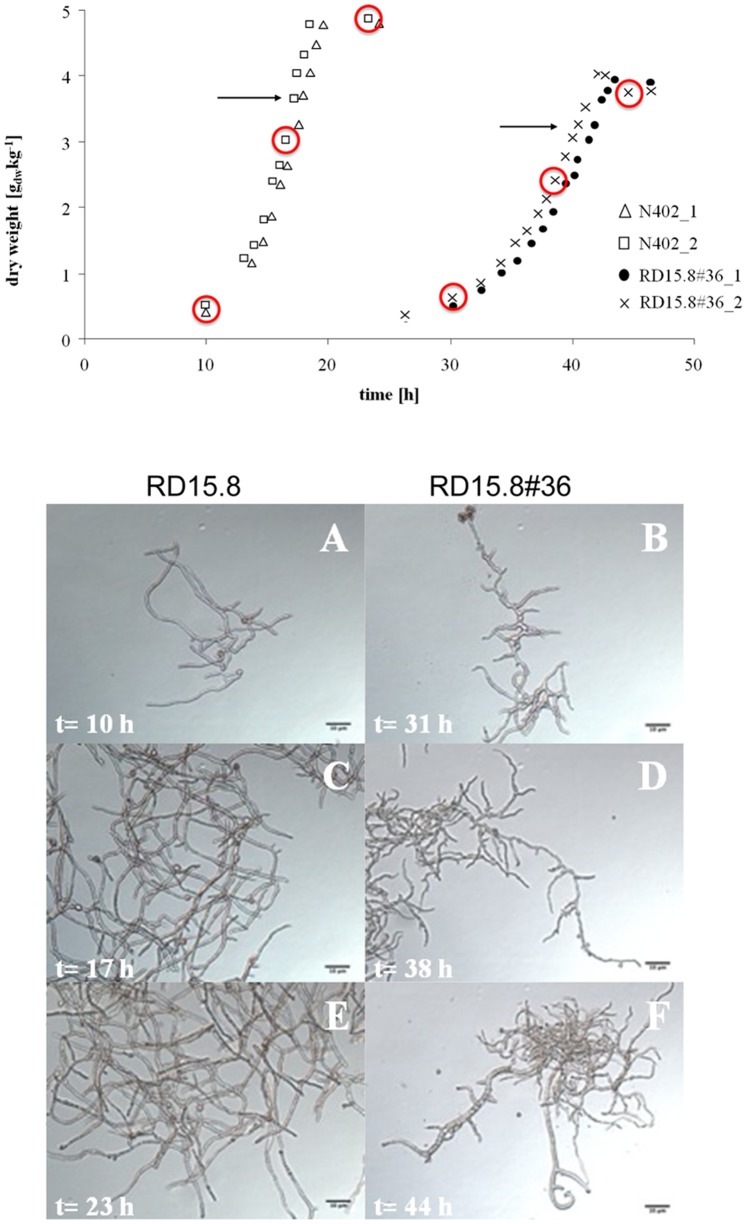
Figure 3. Physiological and morphological of A. niger RD15.8#36 in comparison to wild-type N402.
(Top figure) Biomass accumulation in the duplicate cultures and the maximum specific growth rate (µmax). The arrows indicate the time point when 75% of glucose was consumed and mycelia were harvested for transcriptomic analysis. (Lower figure (A-F) Morphology of the mutant RD15.8#36 in bioreactor cultures in comparison to the wild-type N402 both grown on FM. Mycelium from the exponentially growing culture was harvested at the indicated time points. Scale bar, 10 µm.

