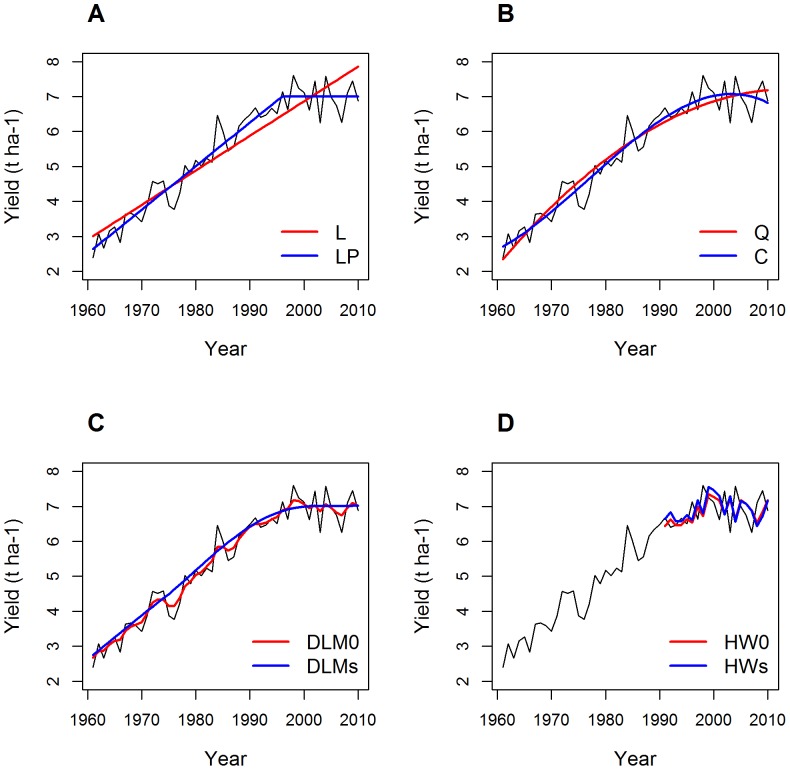
Figure 1. Wheat yield time series in France and fitted values obtained with different models.
A: linear (L) and linear-plus-plateau (LP) models. B: Quadratic (Q) and cubic (C) models. C: dynamic linear models with and without trend (DLMs, DLM0). D: Holt-Winters models with and without trend (HWs, HW0).

