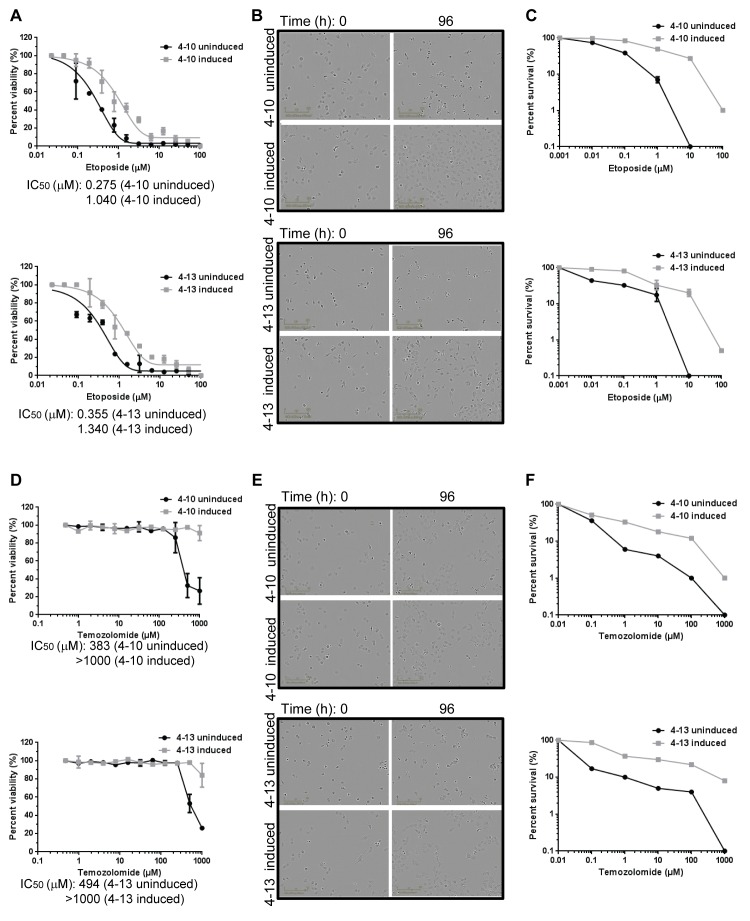
Figure 3. MLH1-deficient NCI-H23 subclones exhibit increased resistance to chemotherapeutic drugs.
NCI-H23 subclones that were uninduced or induced for MLH1 shRNA were treated with etoposide (A-C) or temozolomide (D-F). (A, D) Cells were treated with compound at the concentrations indicated, and cell viability was assessed at 4d using a Cell Titer-Glo assay. The graphs indicate the relative survival for duplicate samples from a single experiment. T tests to compare IC50 values across multiple experiments determined p values of p=0.04 for cells treated with etoposide, and p=0.01 for cells treated with temozolomide. (B, E) Phase contrast images of cells at 0h and 96h time points during the cell viability experiment are shown. Cells were treated with 390 µM etoposide (B) or 500 µM temozolomide (E). (C, F) Cells were treated with compound for 24h at the concentrations indicated, and colony forming ability after compound washout was assessed. The graphs display percent survival at 10d for duplicate samples of cells treated with etoposide (C) or temozolomide (F). Comparison of the LD50 values across multiple experiments by t-test determined p values of p=0.03 for cells treated with etoposide, and p=0.04 for cells treated with temozolomide.

