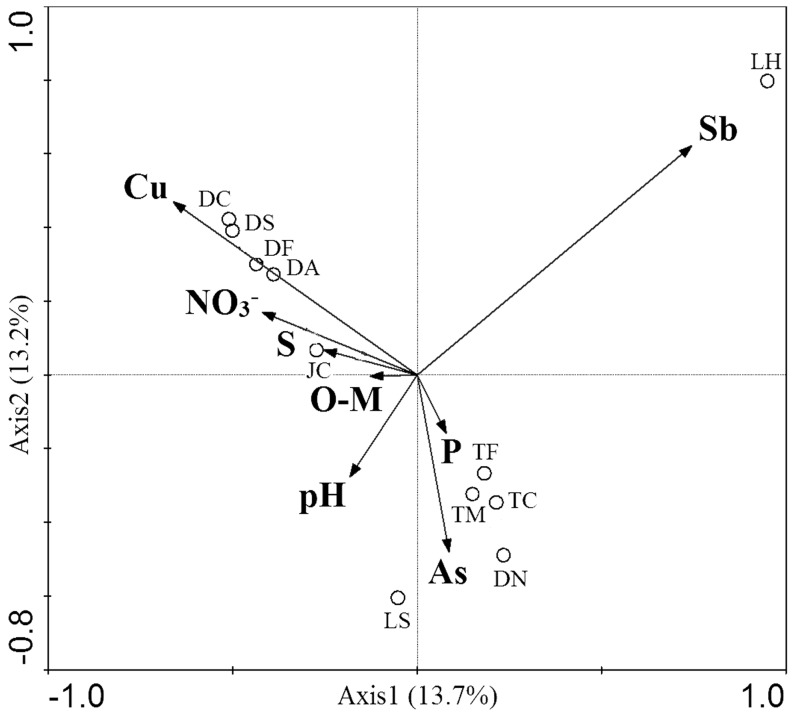
Figure 3. Canonical correspondence analysis (CCA) showing correlations between the culturable microbial population structure and the environmental factors for the 11 soil samples (○, the soil names shown in Fig. S1).
The percentages of variation explained by each axis are shown.

