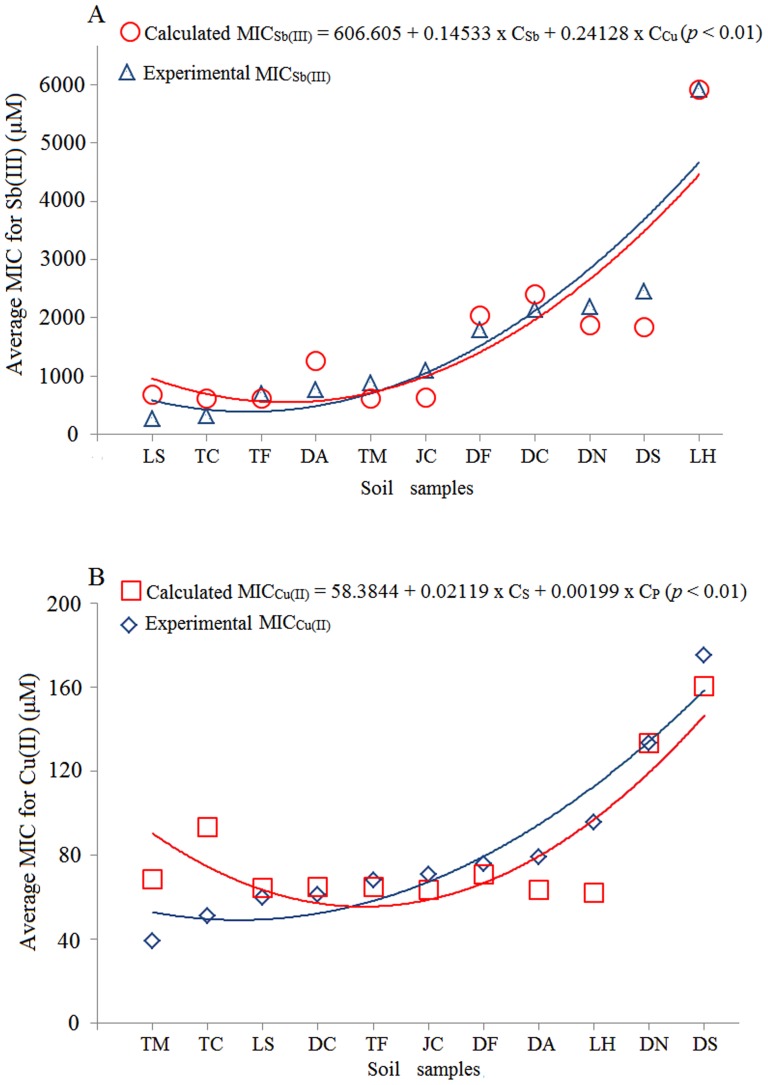
Figure 4. The fitting curves between the experimental MICs and the calculated MICs using the stepwise linear regression models for Sb(III) (A) and for Cu(II) (B).
Blue represents the experimental average MIC values tested in the CDM medium. Reds represents the model back-calculated MIC values using stepwise linear regression analysis. The soil names are shown in Fig. S1. The MICSb(III) and MICCu(II) are the average bacterial MIC for the metal of each soil (µM), and the CSb, CCu, CS and CP are the soil concentrations for Sb, Cu, S and P (mg/kg), respectively.

