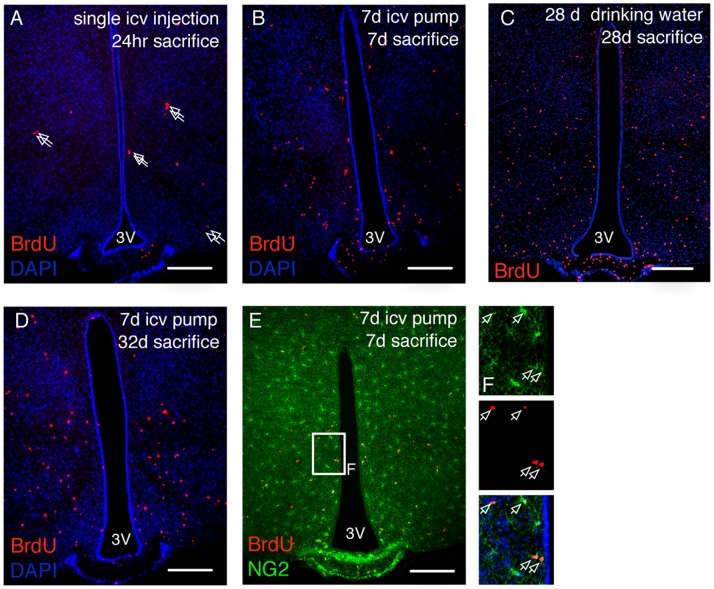
Figure 1. Distribution of newborn cells in the adult hypothalamus.
BrdU incorporation into hypothalamic cells as a measure of cell proliferation was assessed after a single icv injection of BrdU (A), a 7 day icv infusion (B), or a 28 day exposure to BrdU-containing drinking water (C). Arrows in A indicate BrdU+ doublets. (D), distribution of hypothalamic BrdU+ cells at day 32 after the initiation of a 7 day icv BrdU infusion. (E), labelling for both BrdU (red) and NG2 (green) reveals numerous BrdU positive NG2-glia cells. Boxed area is shown enlarged to the right, arrows mark BrdU+ cells. Scale bars = 200 µm.

